TABLE OF CONTENTS
- Introduction
- What Causes a 504 Error?
- 1. Check Monit
- 2. Check top and htop
- 3. Check MySQL
- 4. Check Your Website Database
- 5. Check Your Website Debug/Error Logs
- 6. Check Your Website PHP Settings
- 7. Check Your Access Logs (Are you under attack?)
- 8. Has Your Site Been Compromised?
- Further Troubleshooting Steps if CPU Usage is NOT High
- Fixing WordPress Login / WP-Admin 504 Errors / Upload Timeouts
If you’re experiencing issues only when trying to log into your website and/or inside the /wp-admin area, your website has a codebase issue. Skip to the last section.
IMPORTANT
Unlike a 502 error where PHP or Nginx may be down, 504 errors almost never indicate an issue with the server stack.
DIAGNOSIS STEPS BREAKDOWN
Check Monit:
- Is your disk space full?
- Is your CPU maxed?
- Is your RAM maxed out (and are you running on Swap)?
Check top and htop:
- Check top for CPU steal and high iowait usage
- Check htop to see what’s consuming CPU (if applicable)
- Are there lots of PHP connections?
Check MySQL:
- Are you experiencing table locking?
- Are there sleeping queries?
- Is a specific site hammering MySQL?
AT THIS POINT YOU SHOULD HAVE AN IDEA OF WHAT’S GOING ON AND WHAT’S RESPONSIBLE, INCLUDING WHICH SITE/S IF APPLICABLE.
Website Database:
- Is the database of the site corrupt?
Website PHP Settings:
- Are PHP INI settings misconfigured?
- Are PHP worker settings misconfigured? (FPM / LSAPI)
Error and WP Debug logs:
- Is a plugin erroring and causing the website to run slow?
- Are there errors that need to be fixed?
Access Logs:
- Check the access logs on the sites causing the load – are you experiencing high traffic volume?
- Are XMLRPC or wp-login.php being hit?
- Are a bunch of URIs that don’t exist being hit?
Introduction
504 Gateway Timeout errors are one of the most common performance-related errors.
In a nutshell, they occur when a server “didn’t receive a response from an upstream server it needed to access in order to complete the request“.
Source: Internet Engineering Task Force
The messaging that displays with your 504 error may vary, but the variations don’t indicate any specific issues. Here are a few common examples:
- HTTP Error 504
- HTTP Error 504 – Gateway Timeout
- HTTP 504
- 504 Gateway Timeout
- 504 Gateway Timeout NGINX
- NGINX 504 Gateway Timeout
- 504 Gateway Time-out – The server didn’t respond in time
504 DEBUG
This article details a step-by-step checklist to diagnose your 504 errors by quickly narrowing down the root of the cause.
What Causes a 504 Error?
Here are four categories of issues that can cause 504s:
1. Database/codebase issues
- Database table locking
- Long-running requests due to codebase inefficiencies holding up CPU
- Database corruption
- Database inefficiencies (check for MyISAM tables)
- You’ve been hacked
2. Server overload
- You’re experiencing a traffic surge
- You’re under attack or getting hammered by bot traffic
- You have too many active tasks going on simultaneously maxing CPU, e.g. backups + malware scanning + cache bypassing website traffic
- You’re experiencing CPU steal – your resources are being used but not by you
3. Not enough resources on your server
- Not enough free disk space or RAM and/or excessive swap usage
- PHP settings for your websites are misconfigured and consuming too much RAM
- Too many or too few PHP workers for your sites
4. Proxy/CDN issue
It’s not your server or your website, but a service between you and the server that’s having issues.
REAL WORLD EXAMPLES
- If you have a multisite and multiple people editing their websites all at the same time, you may experience fleeting 504 errors.
- If you have a website that experiences ongoing 504 timeouts, you may have a long-running request caused by a plugin or a code conflict. If combined with misconfigured PHP workers, you could be “clogging” up your server with numerous long-running requests.
- The most common issue we see is a plugin locking up the database causing extreme MySQL inefficiencies.
BUT MY CODEBASE HASN’T CHANGED?
Even if this is true, that doesn’t mean that errors can’t still happen. High traffic can quickly reveal inefficiencies in your codebase, as well as run into major performance bottlenecks of your sites PHP settings have been misconfigured or require excessive amounts of PHP Memory.
- If you’re keeping your website up-to-date, your codebase regularly changes, even if you aren’t adding new plugins. Updates can cause conflicts and developers sometimes release bugs.
- If any of your plugins connect to an external service, this can sometimes lead to issues if there’s a disconnect or a failed transfer of any kind.
- Sometimes there are issues when writing to the database or finishing up database tasks that cause MySQL-related performance problems.
PLUGINS AND 504 ERRORS
Plugins we've seen to be directly responsible for 504 errors in some cases include Blogvault, MalCare, and Rankmath Pro. We've also seen a conflict with Learndash and Oxygen cause 504s. We will update this article with more information as it becomes available. The cause of these errors is often fixed in future updates.
1. Check Monit
First, head to your Servers page in your account and open up Monit for the server you’re having trouble with by clicking on the pie chart icon:

Does the server look healthy? Here we’re looking for anything highlighted in red, and specifically at the CPU and RAM usage at the very top. Here’s a healthy example:
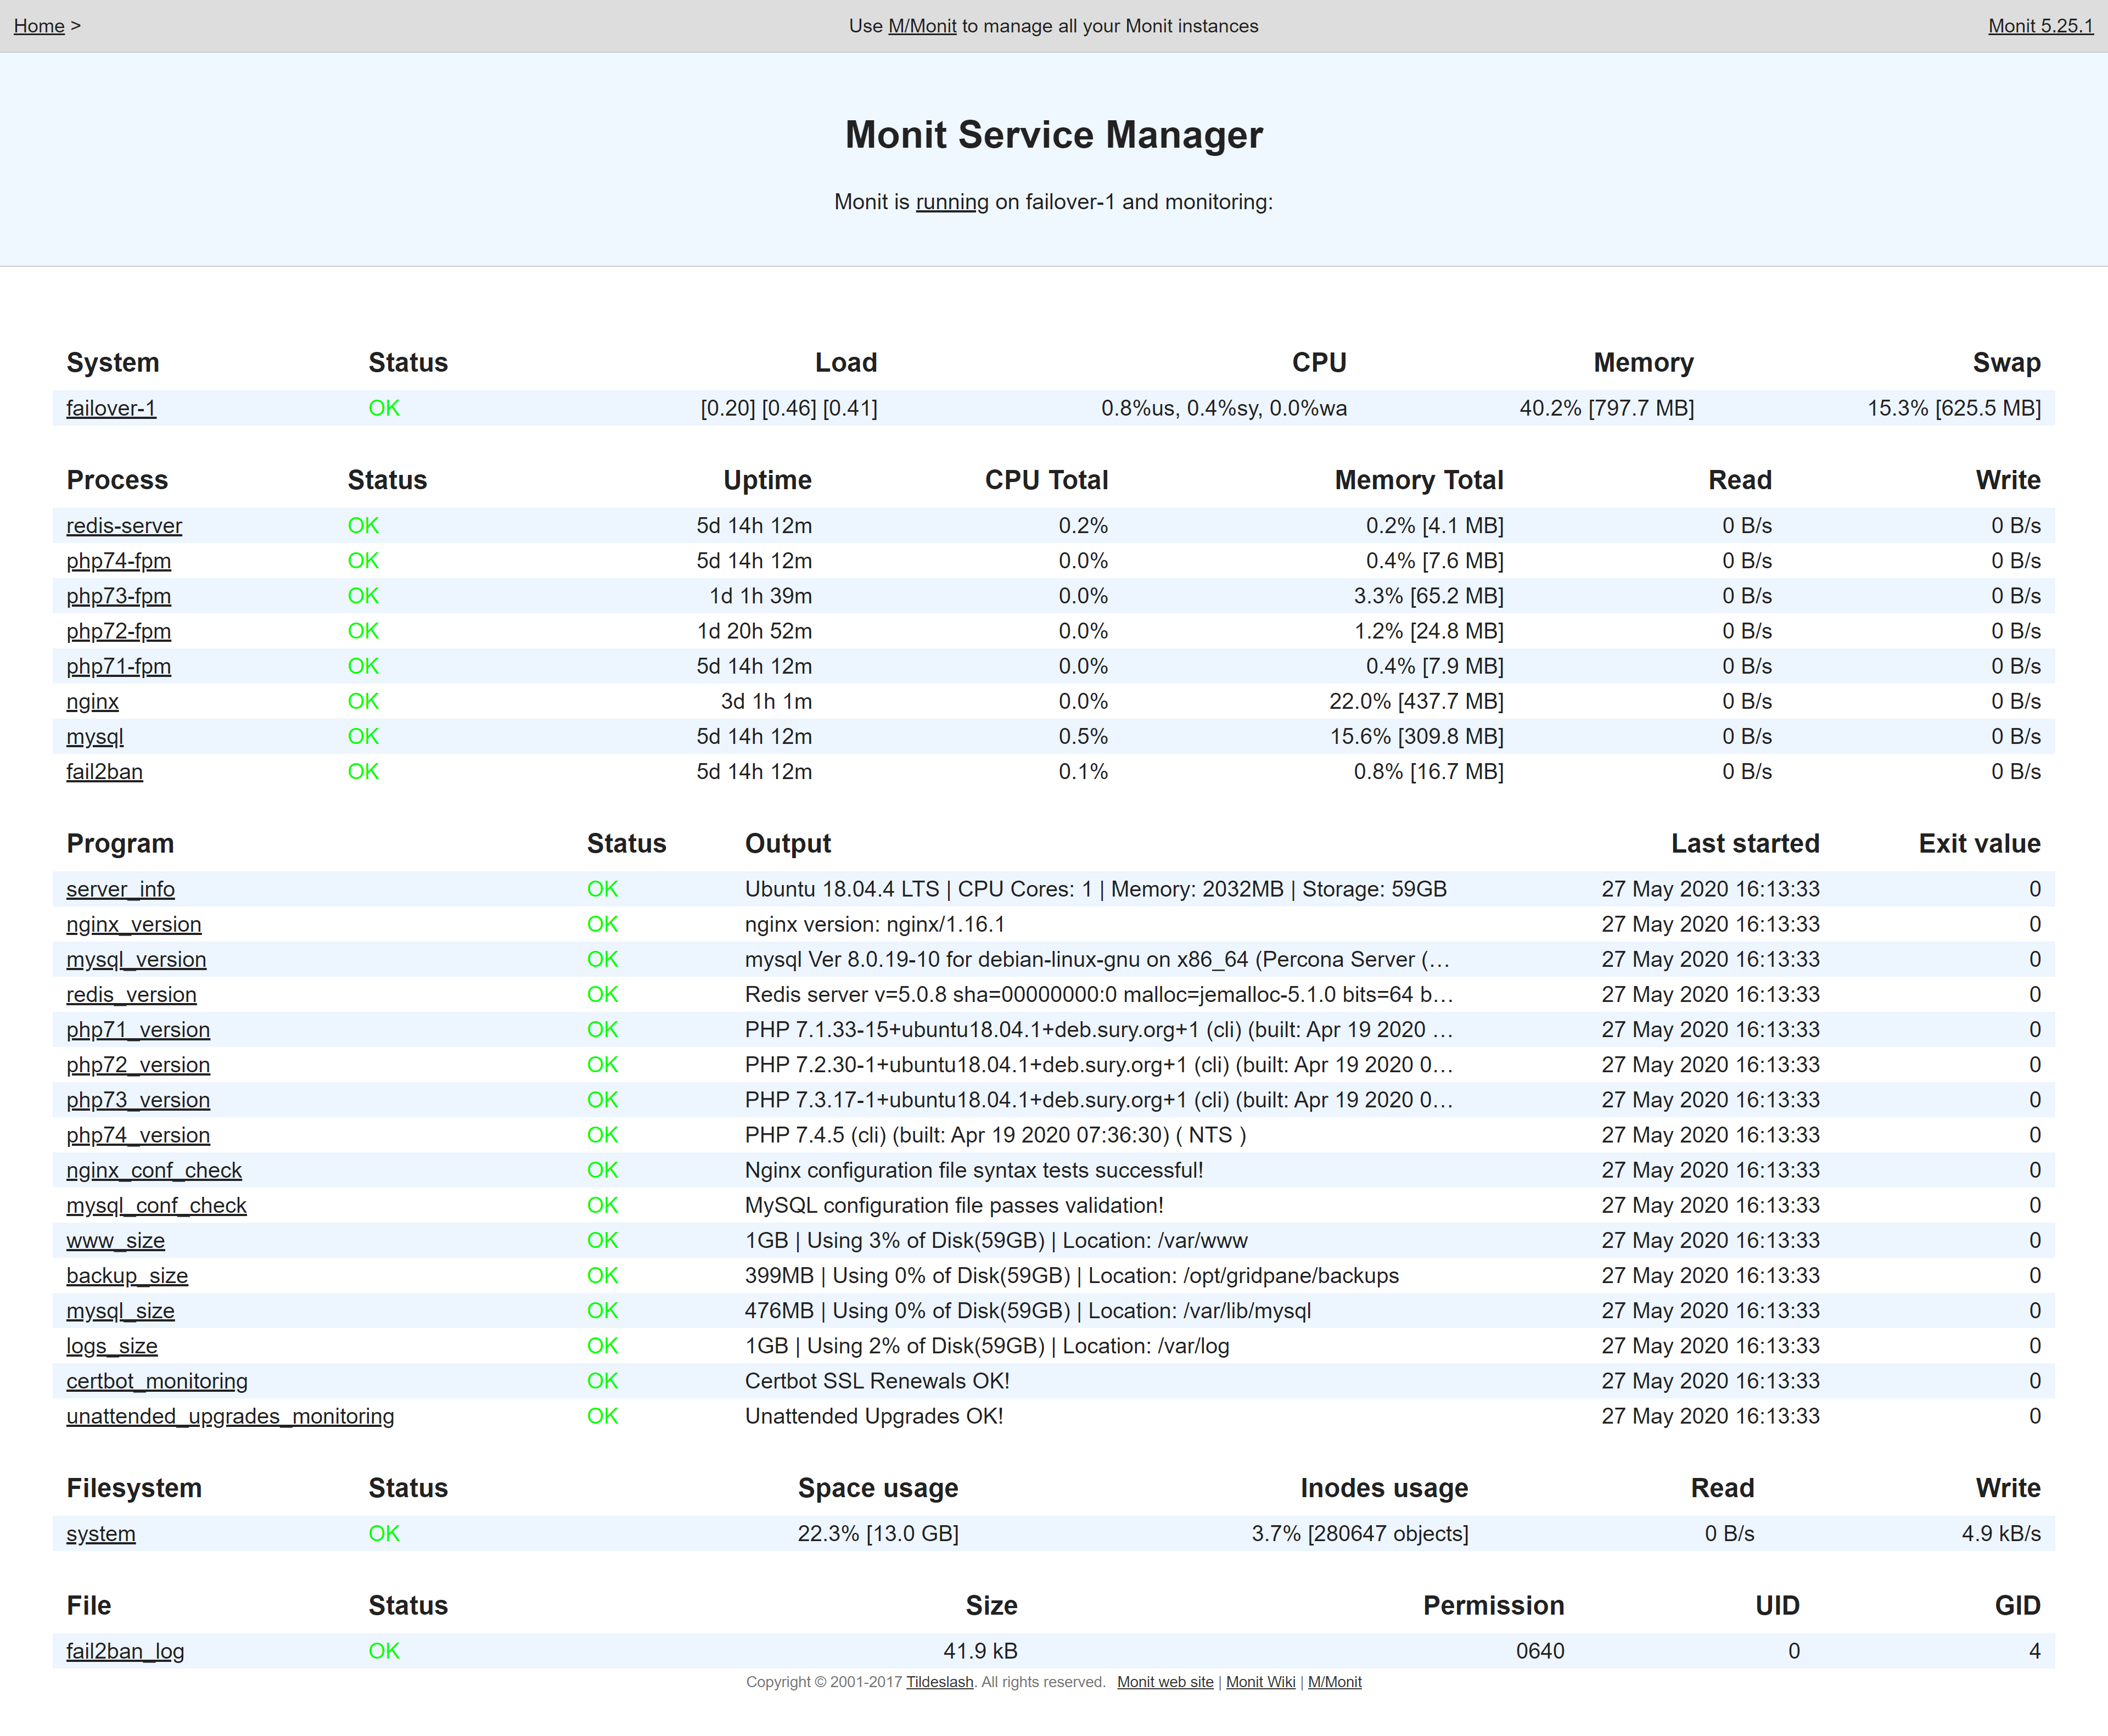
This will tell you a lot about what’s going on inside your server.
Here you need to determine whether or not you have the resources available for your server to run efficiently. If your server is all green and your CPU and RAM seem fine, then it’s likely going to be one of the following:
- Locked database tables,
- Codebase errors
- An issue with your CDN/Proxy service
- A caching issue (your cache needs clearing)
FILESYSTEM: SPACE USAGE IS ABOVE 90%
A common thing we see is disk space being over 90% full and starving the server’s processes of memory, which in turn causes temporary 504 errors.
Space usage is the amount of available disk space on your server. If it’s in the red, you may need to clean up some space or resize your server to the next size up.
This is likely the cause of your problem.
SYSTEM: HIGH CPU USAGE
Sustained high CPU usage means that your server is experiencing a heavy amount of processes, which could mean: –
- One or more of your websites is extremely busy (whether it be real traffic or bot traffic)
- You’re experiencing a DDOS or brute force attack
- You have noisy neighbours on your server that are stealing your resources
- You have slow running processes due to codebase/database issues or you’re running on swap, keeping the CPU forever busy
If you’re experiencing high CPU and RAM usage, proceed to step 4.
PROCESSES: NGINX, MYSQL OR PHP ARE BUSY
If one of your services is busy – e.g. your PHP version, Nginx, or MySQL, then this may be the root cause of your timeouts – the server is there, but visitors can’t retrieve any information because your services are locked up in other long running tasks.
These need to be fixed – either by restarting them, or allocating more memory to them so they can do what they need to do.
This is likely the cause of your problem.
SYSTEM: HIGH MEMORY USAGE
If there’s not enough free memory and/or your system is utilizing a lot of swap, this can slow loading your websites down to a crawl.
PHP worker misconfiguration is often a cause of this, but very large databases (or collectively large databases), misconfigured PHP INI settings, massive sites with huge FastCGI caches, sites that need A LOT of memory to function that are getting a lot of traffic.
2. Check top and htop
Here we want to check two things:
- Is your server experiencing steal? (Noisy neighbours)
- Is it clearly one website that’s bringing everything down?
The goal is to identify what service and/or websites are most active so that you know the next step to take in your troubleshooting.
For this you’ll need to SSH into your server. Please see the following articles to get started:
Step 1. Generate your SSH Key
Step 2. Add your SSH Key to vCanopy (also see Add default SSH Keys)
Step 3. Connect to your server by SSH as Root user (we like and use Termius)
CHECKING FOR CPU STEAL AND IOWAIT WITH TOP
The top command will let you know if other VPS’s on your server are stealing your CPU usage, or if your CPU is waiting on IO/drives. Run:
top
And you’ll see a table appear that looks as follows. We’re interested in the parts highlighted in red:
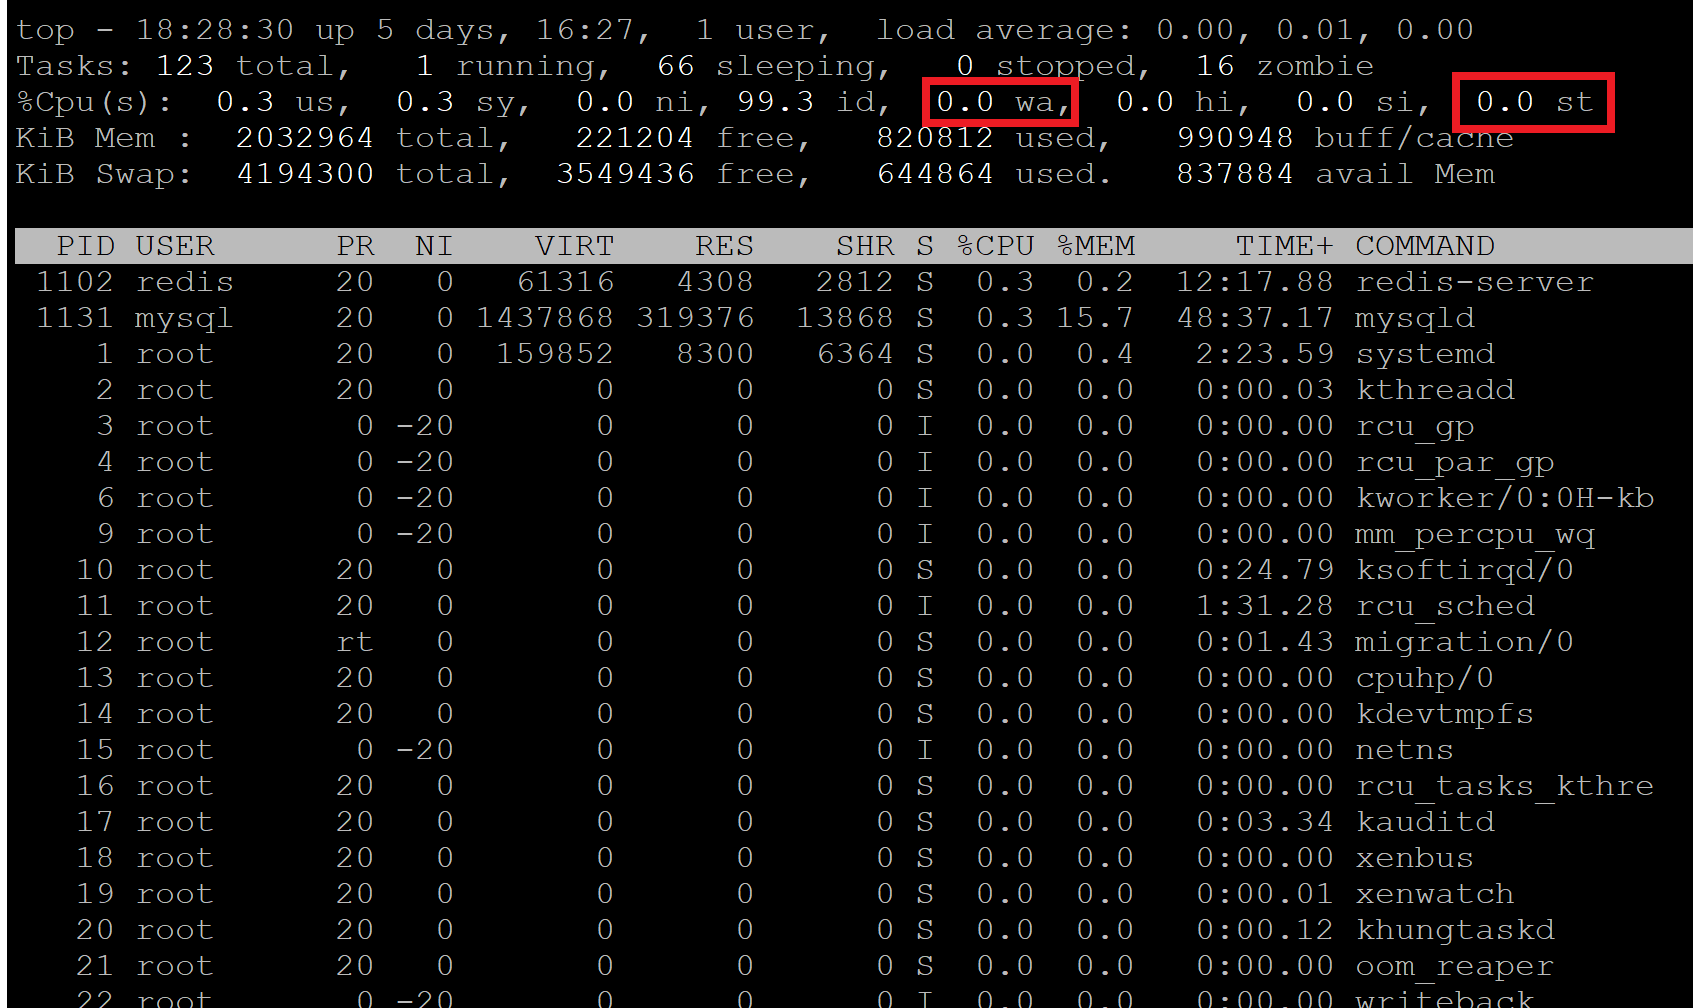
Steal “st”
Here you can see there’s no steal, but sometimes neighbours on your server can potentially steal a lot of your CPU – sometimes over 50% or more.
If you’re experiencing server steal then you need to contact you IaaS provider directly to let them know what’s going on so they can take action accordingly.
I/O Wait “wa”
If this is high then the CPU is waiting on the IO/drives. You can exit top and install run iotop to see which process is causing the most I/O utilization on your server.
To exit top hit Ctrl+C.
You can install iotop with:
apt install iotop
Then run:
iotop
iotop will list all of the processes running with the heaviest process at the very top.

If your steal and wait time are clear, then proceed below. To exit top/iotop hit Ctrl+C.
CHECKING ACTIVE PROCESSES WITH HTOP
The information presented by htop will identify the processes responsible for high resource usage on the server. By default, processes are sorted by CPU usage – the highest at user at the very top of the table. To get started run:
htop
This will open up a table that looks like the following:

Here you’ll be able to see what’s going on and which of your websites are responsible for any high usage.
If you identify your site, you now dig deeper into what’s going on at the website level. It may also be that a different site than you were expecting is the root of the cause. To exit htop hit Ctrl+C.
You can learn more about using top and htop in these articles:
3. Check MySQL
DATABASE TABLE LOCKING / SLEEPING QUERIES
Table lock is one of the most common causes behind both 502 and 504 errors. You can check to see if you have any locked tables by first running:
gp mysql login root
And then run:
show processlist;
If you see “Waiting for table metadata lock”, you’re experiencing table locking. Here’s an example of what this looks like:
mysql> show processlist;
+-------+---------------------+-----------+---------------------+---------+--------+---------------------------------+------------------------------------------------------------------------------------------------------+-----------+---------------+
| Id    | User                | Host      | db                  | Command | Time   | State                           | Info                                                                                                 | Rows_sent | Rows_examined |
+-------+---------------------+-----------+---------------------+---------+--------+---------------------------------+------------------------------------------------------------------------------------------------------+-----------+---------------+
|     5 | event_scheduler     | localhost | NULL                | Daemon  | 558150 | Waiting on empty queue          | NULL                                                                                                 |         0 |             0 |
| 34478 | VOO_example_com | localhost | VOO_example_com | Sleep   |  70388 |                                 | NULL                                                                                                 |         0 |             0 |
| 34479 | VOO_example_com | localhost | NULL                | Sleep   |  70388 |                                 | NULL                                                                                                 |      6230 |          6230 |
| 34480 | VOO_example_com | localhost | NULL                | Sleep   |  70387 |                                 | NULL                                                                                                 |    748034 |        748034 |
| 40581 | VOO_example_com | localhost | VOO_example_com | Query   |  14241 | Waiting for table metadata lock | DROP TABLE IF EXISTS wp_bv_ip_store                                                                  |         0 |             0 |
| 40582 | VOO_example_com | localhost | VOO_example_com | Query   |  14140 | Waiting for table metadata lock | DROP TABLE IF EXISTS wp_bv_ip_store                                                                  |         0 |             0 |
| 40583 | VOO_example_com | localhost | VOO_example_com | Query   |  14040 | Waiting for table metadata lock | DROP TABLE IF EXISTS wp_bv_ip_store                                                                  |         0 |             0 |
| 40984 | VOO_example_com | localhost | VOO_example_com | Query   |  12582 | Waiting for table metadata lock | SELECT * FROM wp_bv_ip_store WHERE '�<:' >= `start_ip_range` && '�<:' <= `end_ip_range` && `is_lp`   |         0 |             0 |
| 40985 | VOO_example_com | localhost | VOO_example_com | Query   |  12518 | Waiting for table metadata lock | SELECT * FROM wp_bv_ip_store WHERE '�<:' >= `start_ip_range` && '�<:' <= `end_ip_range` && `is_lp`   |         0 |             0 |
This particular example was MalCare, which shares the same table prefix with Blogvault – another plugin we’ve seen at the cause. Other plugins we’ve seen include Cleantalk, Rank Math, and WPvivid.
Exit MySQL with:
exit
How to Fix it
You can restart MySQL with the following command:
gp mysql restart
You can also restart MySQL inside of Monit as well.
We sometimes see this on WaaS networks. Multisites are heavy on database processes and you may be experiencing table locking. You’ll want to ensure that your using InnoDB and not MyISAM as above, and then determine whether this is related to our backup system.
Local Website Backups
If you’re experiencing these issues around the start of every hour, this is maybe related to our older backup system, Borg, running and locking your tables while it takes the backups. If you have a large website that takes a long time to backup, this could frequently impact your performance for extended periods of time.
4. Check Your Website Database
IMPAIRED DATABASE
A corrupt WordPress database may also trigger a 504 gateway timeout error. You check the status of your database using GP-WP-CLI. Inside your server run the following replacing “site.url” with your domain name:
gp wp site.url db check
If you find any crashed tables you can repair them with the following command – but always make sure you have a backup before doing any kind of database work:
gp wp site.url db repair
IS YOUR DATABASE SLOW, IMPAIRED, OR LACKING RESOURCES?
Is your website’s database slowing things down? Following the Query Monitor guide above should help you in determining this, but here are some things we see on support.
MyISAM
If your database is using MyISAM instead of InnoDB, this may be seriously harming your website’s performance. Check out our guide on converting MyISAM to InnoDB here:
5. Check Your Website Debug/Error Logs
IS A PLUGIN ERRORING AND CAUSING YOUR WEBSITE TO RUN SLOW?
The best way to begin diagnosing website level issues is to use WP_DEBUG and Query Monitor. Please check out our full article on how to use these tools to identify slow queries and/or PHP errors on your website:
WordPress Debug and Query Monitor
If you find that it’s a plugin, theme, or core functionality that’s the root cause of your issues, you can increase the time out length to see if this helps prevent 504s.
Increasing time outs is more of a band-aid than a genuine solution, however, it may help in the short term. This is a quick fix code snippet you can copy and paste into your server:
gp stack nginx -limits -client-body-timeout 600 && gp stack nginx -limits -client-header-timeout 600 && gp stack nginx -fastcgi -send-timeout 600 && gp stack nginx -fastcgi -read-timeout 600 && gp stack nginx -proxy -send-timeout 600 && gp stack nginx -proxy -read-timeout 600 && gp stack php 7.2 -max-exec-time 600 && gp stack php 7.3 -max-exec-time 600 && gp stack php 7.2 -max-input-time 600 && gp stack php 7.3 -max-input-time 600 && gp stack php 7.2 -max-input-vars 100000 && gp stack php 7.3 -max-input-vars 100000 && gp ngx restart && gp php 7.2 restart && gp php 7.3 restart && gp php 7.4 restart
Please see the final section of this article for the individual commands.
6. Check Your Website PHP Settings
PHP INI MISCONFIGURATION
This is rarely an issue, but sometimes see sites that are badly misconfigured – Max Execution Time and PHP memory limit, and other settings are excessively high.
PHP Memory Limit should only be higher than 256 if your website requires more memory than this. Other settings should generally not be higher than the defaults. This is a healthy set of PHP INI settings:
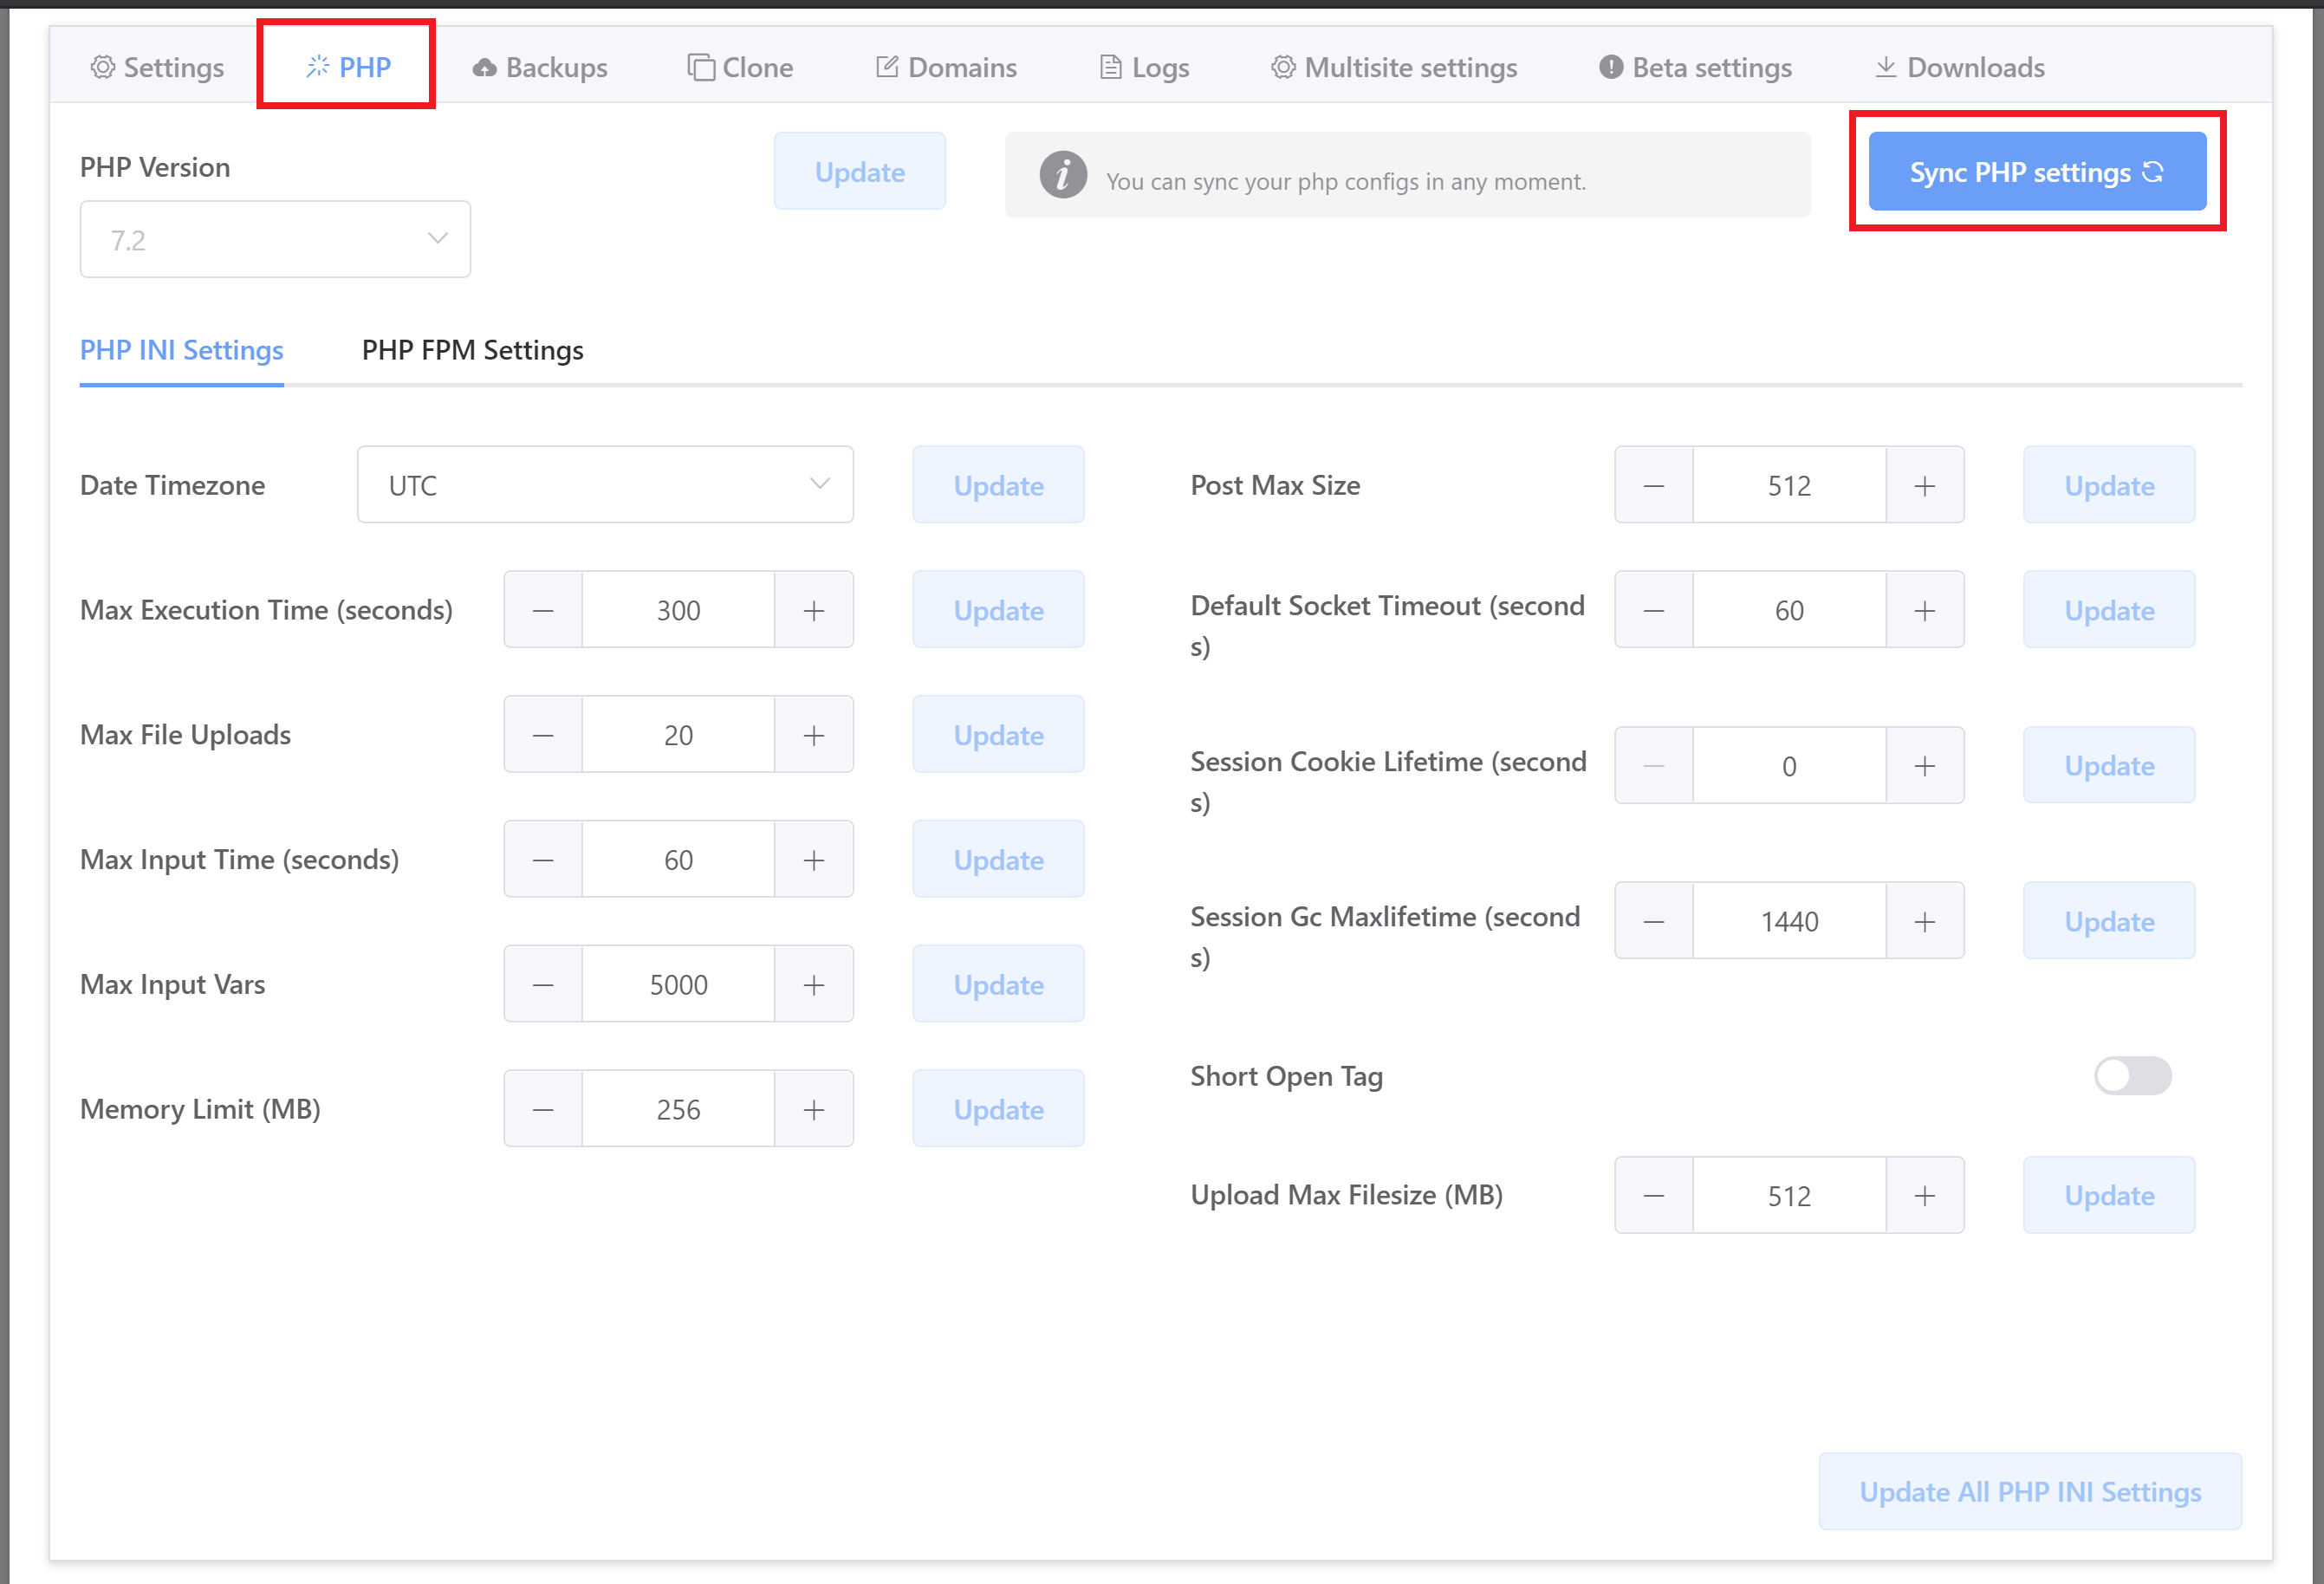
PHP WORKER MISCONFIGURATION
If you’re experiencing long-running requests and you have too many PHP workers set for the available resources, you could be creating a backlog of tasks. This backlog can slow everything, including even simple requests, to a halt.
Open up your website’s customizer and click through to the PHP tab. Next, open the PHP FPM Settings tab and check your configuration. Below are our recommendations for each worker type.
Ondemand
Switch to Dynamic or Static.
Dynamic
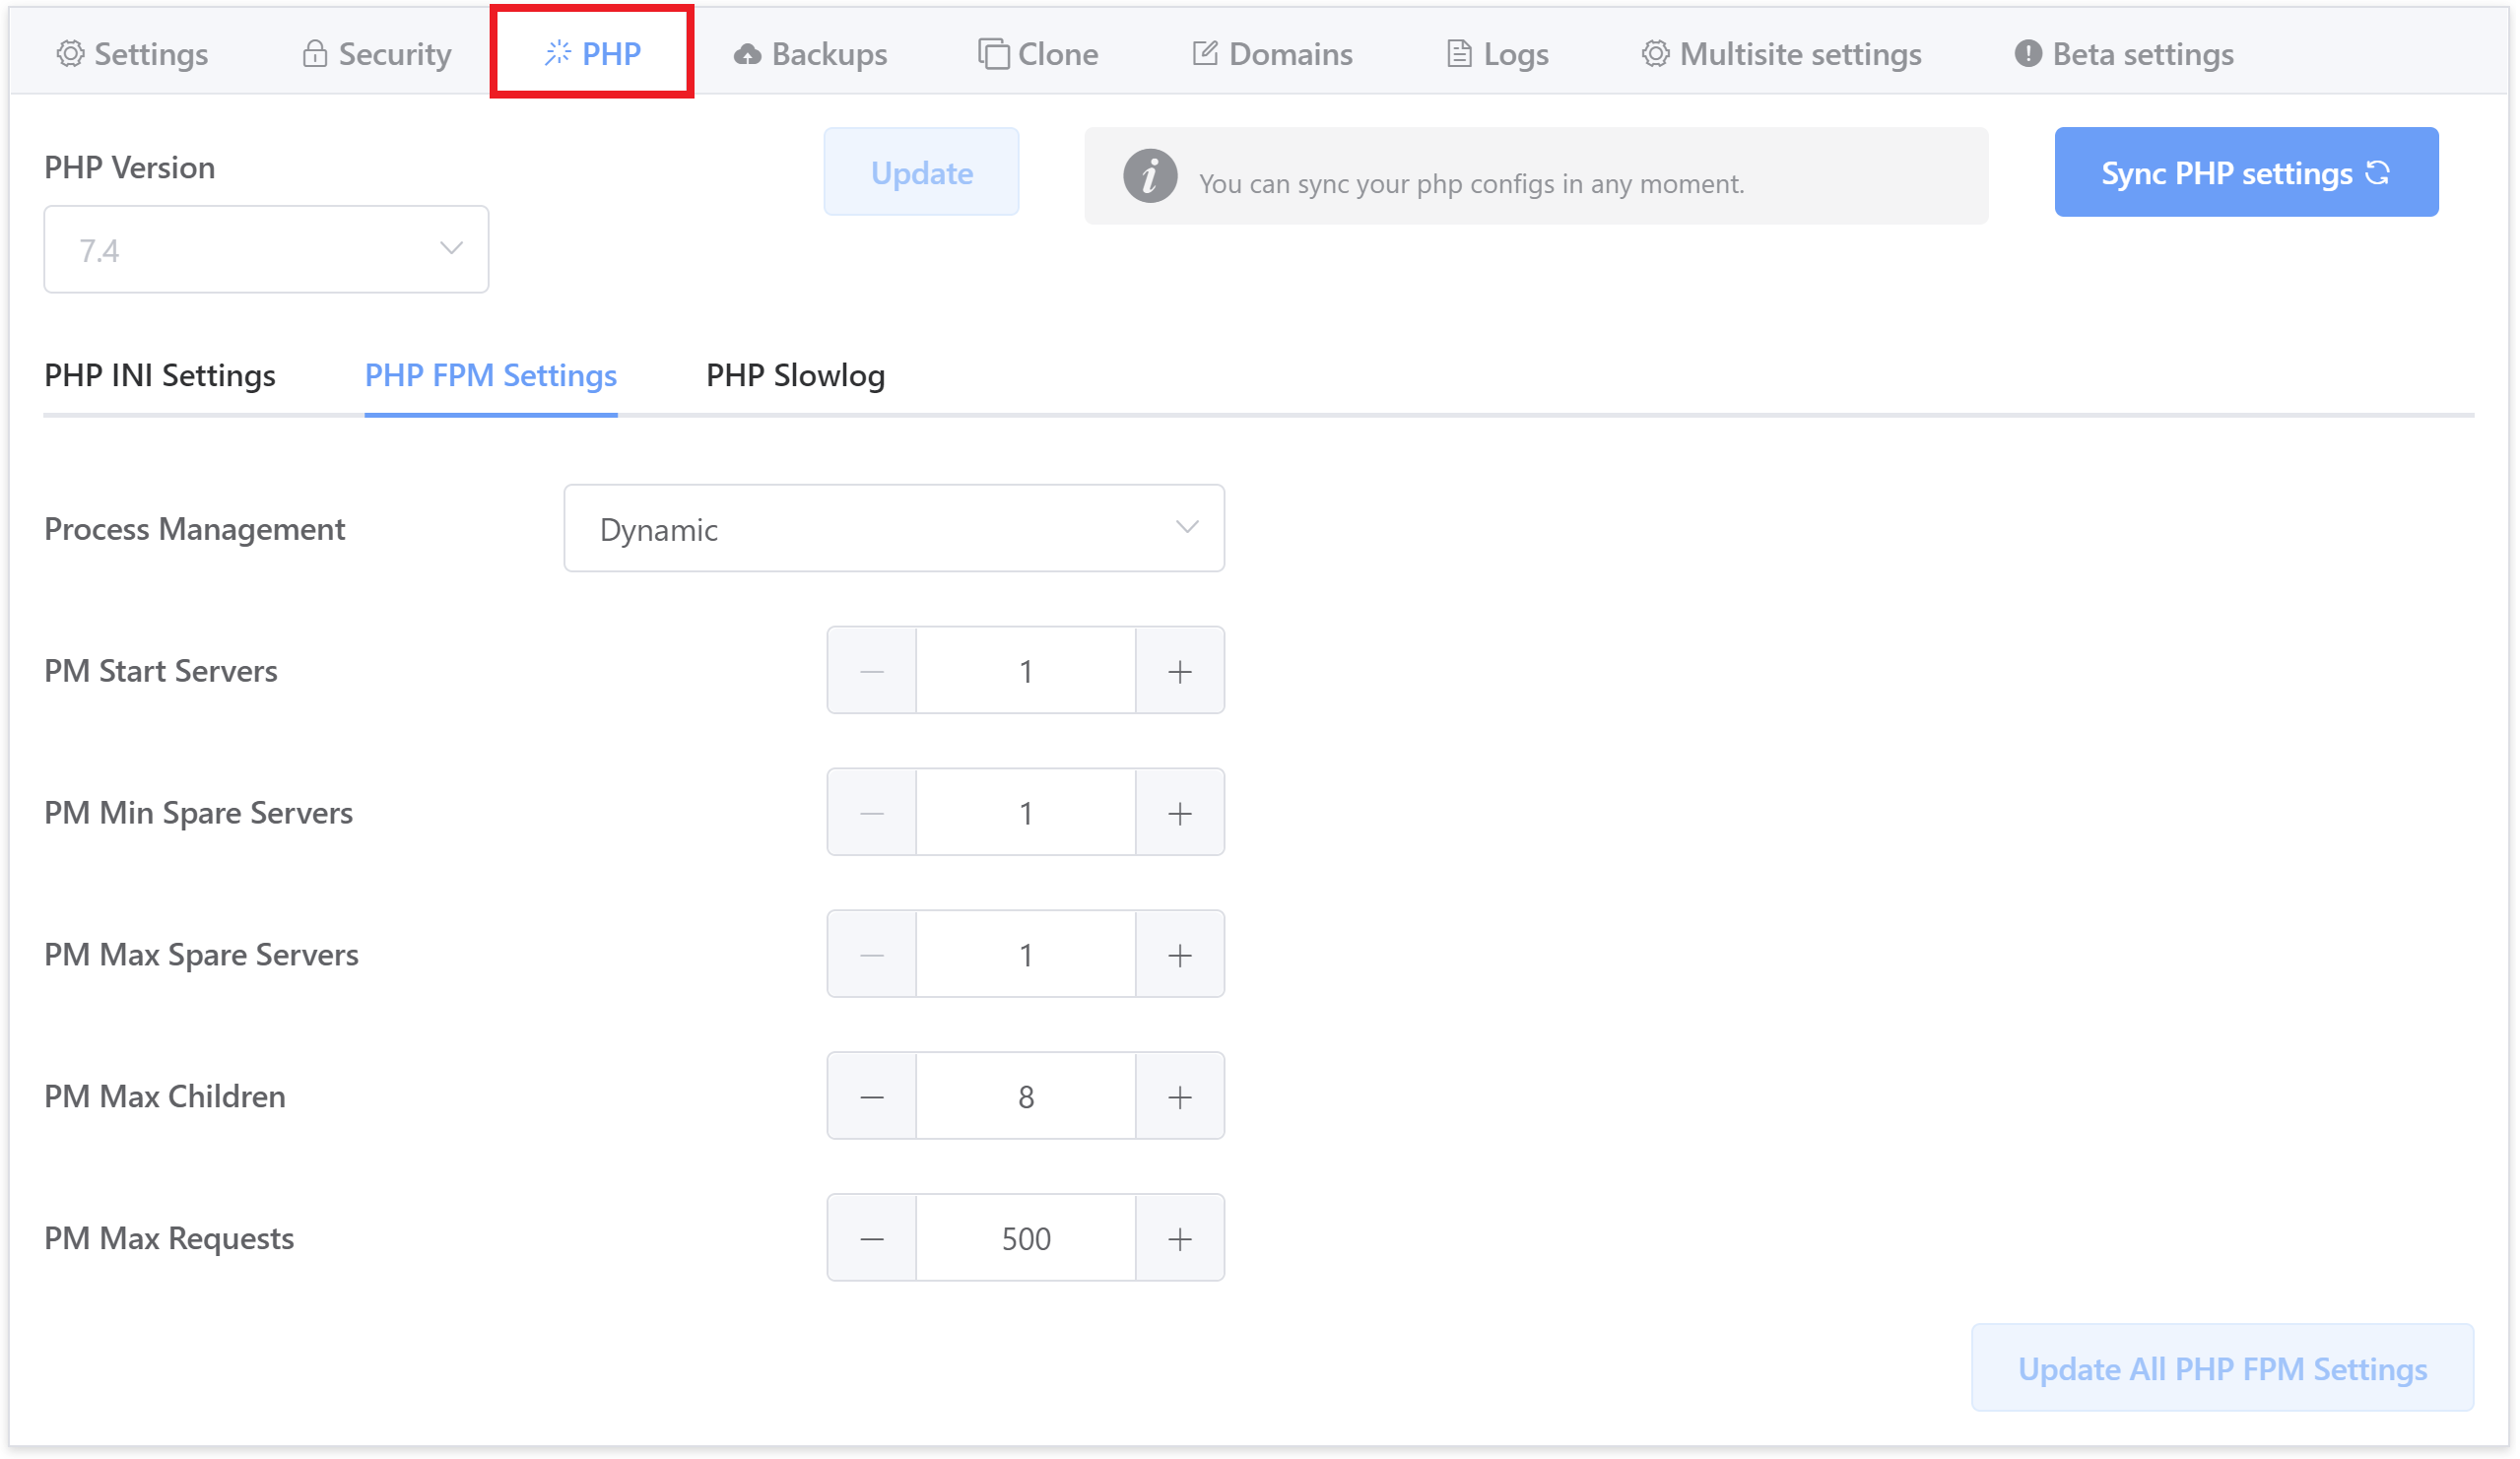
For most websites, we recommend Dynamic with a minimum of one “PM Start Server” (active worker), and setting “PM Max Children” to 4 x CPU core (for example if you have a 1 CPU server, set it to 4, if you have a 2 CPU server, set it to 8 and so on). Below is a screenshot from a 2 CPU VPS:
If you’re still experiencing issues, try 3 x workers per CPU core.
Static
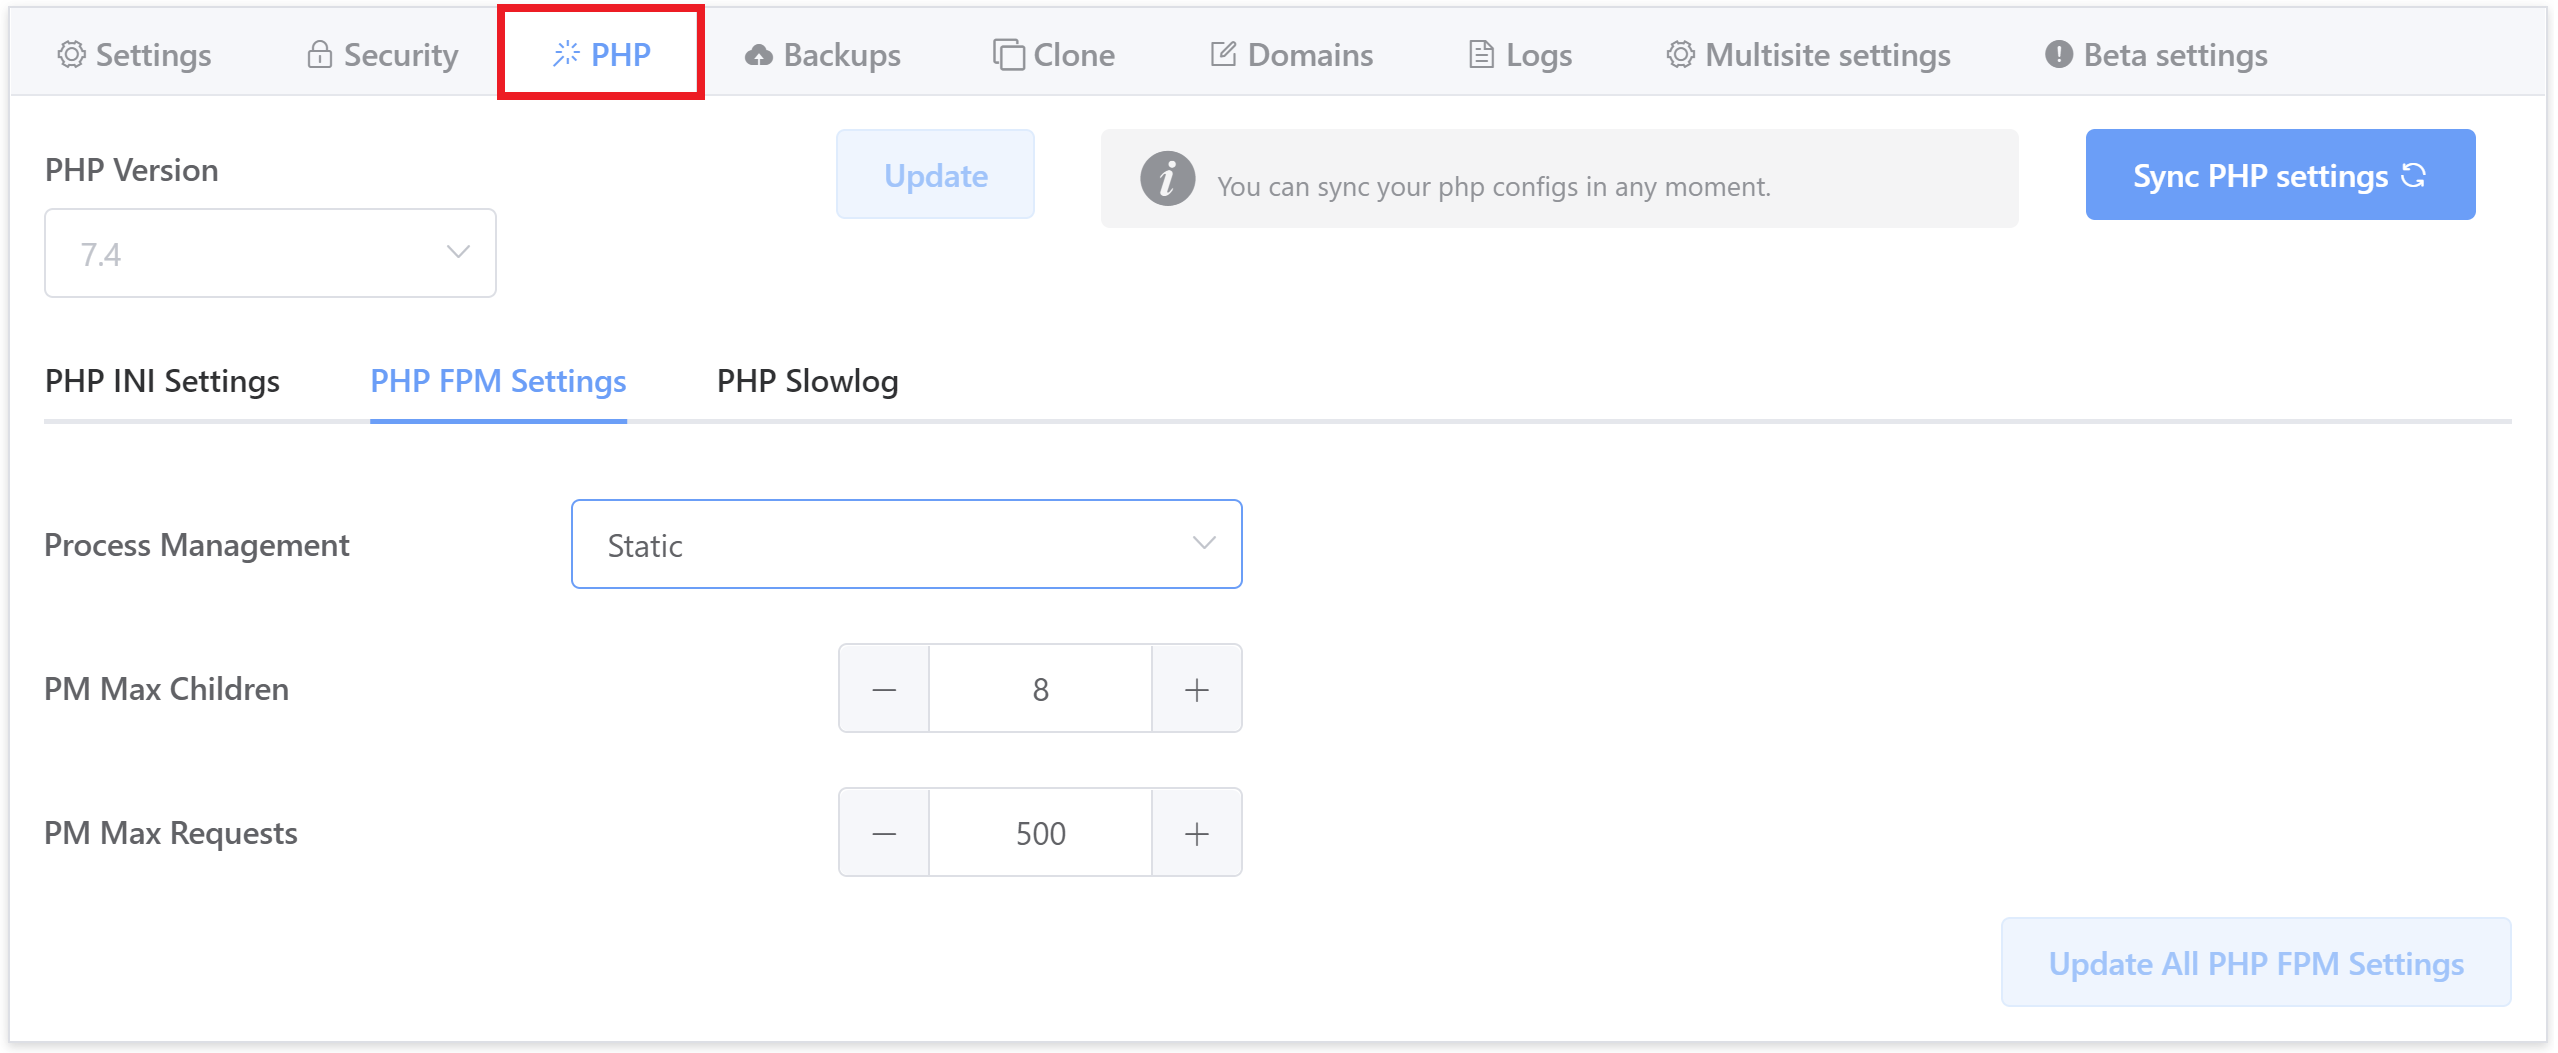
Static is better for more dynamic websites and ensures that you have workers active at all times, ready to process PHP. WooCommerce, LMS websites, and sites with lots of cache-bypassing traffic will benefit from static workers. If you’re experiencing timeouts, try adjusting this setting to 3 workers x CPU core. For example, the screenshot below is for a 2 CPU VPS:
If you’re still experiencing 504s you could reduce to 2 workers per core. This by itself will likely not fix your issue or be the root cause, but it will ensure you’re not pouring gas on the fire.
7. Check Your Access Logs
If your website is experiencing legitimately high traffic and it isn’t under attack, then you likely need a bigger server to handle the load.
1. IS YOUR WEBSITE UNDER ATTACK?
The quickest way to determine whether your website is under attack is to check the Nginx Error log and check the number of rate-limiting errors. If you’re being brute-forced, you’ll see something similar to following targeting either xmlrpc.php or wp-login.php:
[23/Apr/2020:16:23:43 +0000] 69.123.145.184 1.312 - yourwebsite.com "POST //xmlrpc.php HTTP/1.1" 200 413 "-" "Mozilla/5.0 (Windows NT 10.0; Win64; x64) AppleWebKit/537.36 (KHTML, like Gecko) Chrome/78.0.3904.108 Safari/537.36"
[23/Apr/2020:16:23:46 +0000] 69.123.145.184 1.784 - yourwebsite.com "POST //xmlrpc.php HTTP/1.1" 200 413 "-" "Mozilla/5.0 (Windows NT 10.0; Win64; x64) AppleWebKit/537.36 (KHTML, like Gecko) Chrome/78.0.3904.108 Safari/537.36"
[23/Apr/2020:16:23:48 +0000] 68.123.179.184 2.624 - yourwebsite.com "POST //xmlrpc.php HTTP/1.1" 200 413 "-" "Mozilla/5.0 (Windows NT 10.0; Win64; x64) AppleWebKit/537.36 (KHTML, like Gecko) Chrome/78.0.3904.108 Safari/537.36"
[23/Apr/2020:16:23:52 +0000] 69.123.145.184 2.908 - yourwebsite.com "POST //xmlrpc.php HTTP/1.1" 200 413 "-" "Mozilla/5.0 (Windows NT 10.0; Win64; x64) AppleWebKit/537.36 (KHTML, like Gecko) Chrome/78.0.3904.108 Safari/537.36"
[23/Apr/2020:16:23:55 +0000] 69.123.145.184 2.764 - yourwebsite.com "POST //xmlrpc.php HTTP/1.1" 200 413 "-" "Mozilla/5.0 (Windows NT 10.0; Win64; x64) AppleWebKit/537.36 (KHTML, like Gecko) Chrome/78.0.3904.108 Safari/537.36"
[23/Apr/2020:16:23:57 +0000] 69.123.145.184 1.588 - yourwebsite.com "POST //xmlrpc.php HTTP/1.1" 200 413 "-" "Mozilla/5.0 (Windows NT 10.0; Win64; x64) AppleWebKit/537.36 (KHTML, like Gecko) Chrome/78.0.3904.108 Safari/537.36"
[23/Apr/2020:16:23:59 +0000] 69.123.145.184 1.864 - yourwebsite.com "POST //xmlrpc.php HTTP/1.1" 200 413 "-" "Mozilla/5.0 (Windows NT 10.0; Win64; x64) AppleWebKit/537.36 (KHTML, like Gecko) Chrome/78.0.3904.108 Safari/537.36"
[23/Apr/2020:16:29:55 +0000] 69.123.145.184 1.092 - yourwebsite.com "POST //wp-login.php HTTP/1.1" 200 6317 "https://yourwebsite.com//wp-login.php" "Mozilla/5.0 (Windows NT 10.0; Win64; x64) AppleWebKit/537.36 (KHTML, like Gecko) Chrome/78.0.3904.108 Safari/537.36"
[23/Apr/2020:16:29:57 +0000] 69.123.145.184 1.464 - yourwebsite.com "POST //wp-login.php HTTP/1.1" 200 6317 "https://yourwebsite.com//wp-login.php" "Mozilla/5.0 (Windows NT 10.0; Win64; x64) AppleWebKit/537.36 (KHTML, like Gecko) Chrome/78.0.3904.108 Safari/537.36"
[23/Apr/2020:16:29:59 +0000] 69.123.145.184 1.444 - yourwebsite.com "POST //wp-login.php HTTP/1.1" 200 6317 "https://yourwebsite.com//wp-login.php" "Mozilla/5.0 (Windows NT 10.0; Win64; x64) AppleWebKit/537.36 (KHTML, like Gecko) Chrome/78.0.3904.108 Safari/537.36"
[23/Apr/2020:16:30:00 +0000] 69.123.145.184 1.352 - yourwebsite.com "POST //wp-login.php HTTP/1.1" 200 6317 "https://yourwebsite.com//wp-login.php" "Mozilla/5.0 (Windows NT 10.0; Win64; x64) AppleWebKit/537.36 (KHTML, like Gecko) Chrome/78.0.3904.108 Safari/537.36"
[23/Apr/2020:16:30:02 +0000] 69.123.145.184 1.612 - yourwebsite.com "POST //wp-login.php HTTP/1.1" 200 6317 "https://yourwebsite.com//wp-login.php" "Mozilla/5.0 (Windows NT 10.0; Win64; x64) AppleWebKit/537.36 (KHTML, like Gecko) Chrome/78.0.3904.108 Safari/537.36"
[23/Apr/2020:16:30:05 +0000] 69.123.145.184 2.264 - yourwebsite.com "POST //wp-login.php HTTP/1.1" 200 6317 "https://yourwebsite.com//wp-login.php" "Mozilla/5.0 (Windows NT 10.0; Win64; x64) AppleWebKit/537.36 (KHTML, like Gecko) Chrome/78.0.3904.108 Safari/537.36"
[23/Apr/2020:16:30:06 +0000] 69.123.145.184 1.604 - yourwebsite.com "POST //wp-login.php HTTP/1.1" 200 6317 "https://yourwebsite.com//wp-login.php" "Mozilla/5.0 (Windows NT 10.0; Win64; x64) AppleWebKit/537.36 (KHTML, like Gecko) Chrome/78.0.3904.108 Safari/537.36"
If you’re not using XML RPC and it’s getting hit, you can disable it inside your website’s customizer. Open it up and then click through to the Security tab, and then to the additional measures. Click the XML RPC toggle.
If you’re not already using WPFail2Ban, you should activate this too.
2.1 DISCOVER ATTACKING IPS ON NGINX
Next, check your access logs on your server with the following commands. The first two will check for IPs hitting xmlrpc.php and wp-login.php, and the third will list IP accessing your server as a whole.
Check for hits on xmlrpc.php:
cat /var/log/nginx/*access.log | grep xmlrpc | awk '{print $1}' | sort | uniq -cCheck for hits on wp-login.php:
cat /var/log/nginx/*access.log | grep wp-login | awk '{print $1}' | sort | uniq -cCheck overall access for the day:
Here you’ll need to replace the date with the actual current date:
cat /var/log/nginx/*access.log | grep '11/Dec/2021' | sudo awk '{ print $1}' | sort | uniq -c | sort -nrHere you may see some IPs with hundreds or thousands of hits on your website. If that’s the case, run this to display the top 50:
cat /var/log/nginx/*access.log | grep '11/Dec/2021' | sudo awk '{ print $1}' | sort | uniq -c | sort -nr | head -n 502.2 DISCOVER ATTACKING IPS ON OPENLITESPEED
Check for hits on xmlrpc.php:
cat /var/log/ols/*access.log | grep xmlrpc | awk '{print $1}' | sort | uniq -cCheck for hits on wp-login.php:
cat /var/log/ols/*access.log | grep wp-login | awk '{print $1}' | sort | uniq -cCheck overall access for the day:
Here you’ll need to replace the date with the actual current date:
cat /var/log/ols/*access.log | grep '11/Dec/2021' | sudo awk '{ print $1}' | sort | uniq -c | sort -nrHere you may see some IPs with hundreds or thousands of hits on your website. If that’s the case, run this to display the top 50:
cat /var/log/ols/*access.log | grep '11/Dec/2021' | sudo awk '{ print $1}' | sort | uniq -c | sort -nr | head -n 503. BAN OFFENDING IP ADDRESSES
The above commands may display a list like this:
root@ols-test-server:~# sudo awk '{ print $1}' /var/log/ols/*access.log | sort | uniq -c | sort -nr | head -n 10
1333 "94.137.186.125
399 "1.46.145.212
349 "107.150.94.78
336 "54.93.217.201
333 "122.155.174.174
195 "185.70.52.218
139 "185.225.234.174
92 "185.225.234.59
88 "185.225.234.199
65 "1.46.4.227
You can block these IP’s by running the following command on your server:
ufw deny from {IP.Address}For example:
ufw deny from 199.199.199.19
4. MITIGATE ATTACKS WITH CLOUDFLARE
If you’re using Cloudflare or have a security plugin such as WordPress you can add these IP’s to your blacklist, but you’ll also want to check out our Fail2Ban article here:
Configuring Fail2Ban to Prevent Brute Force Attacks
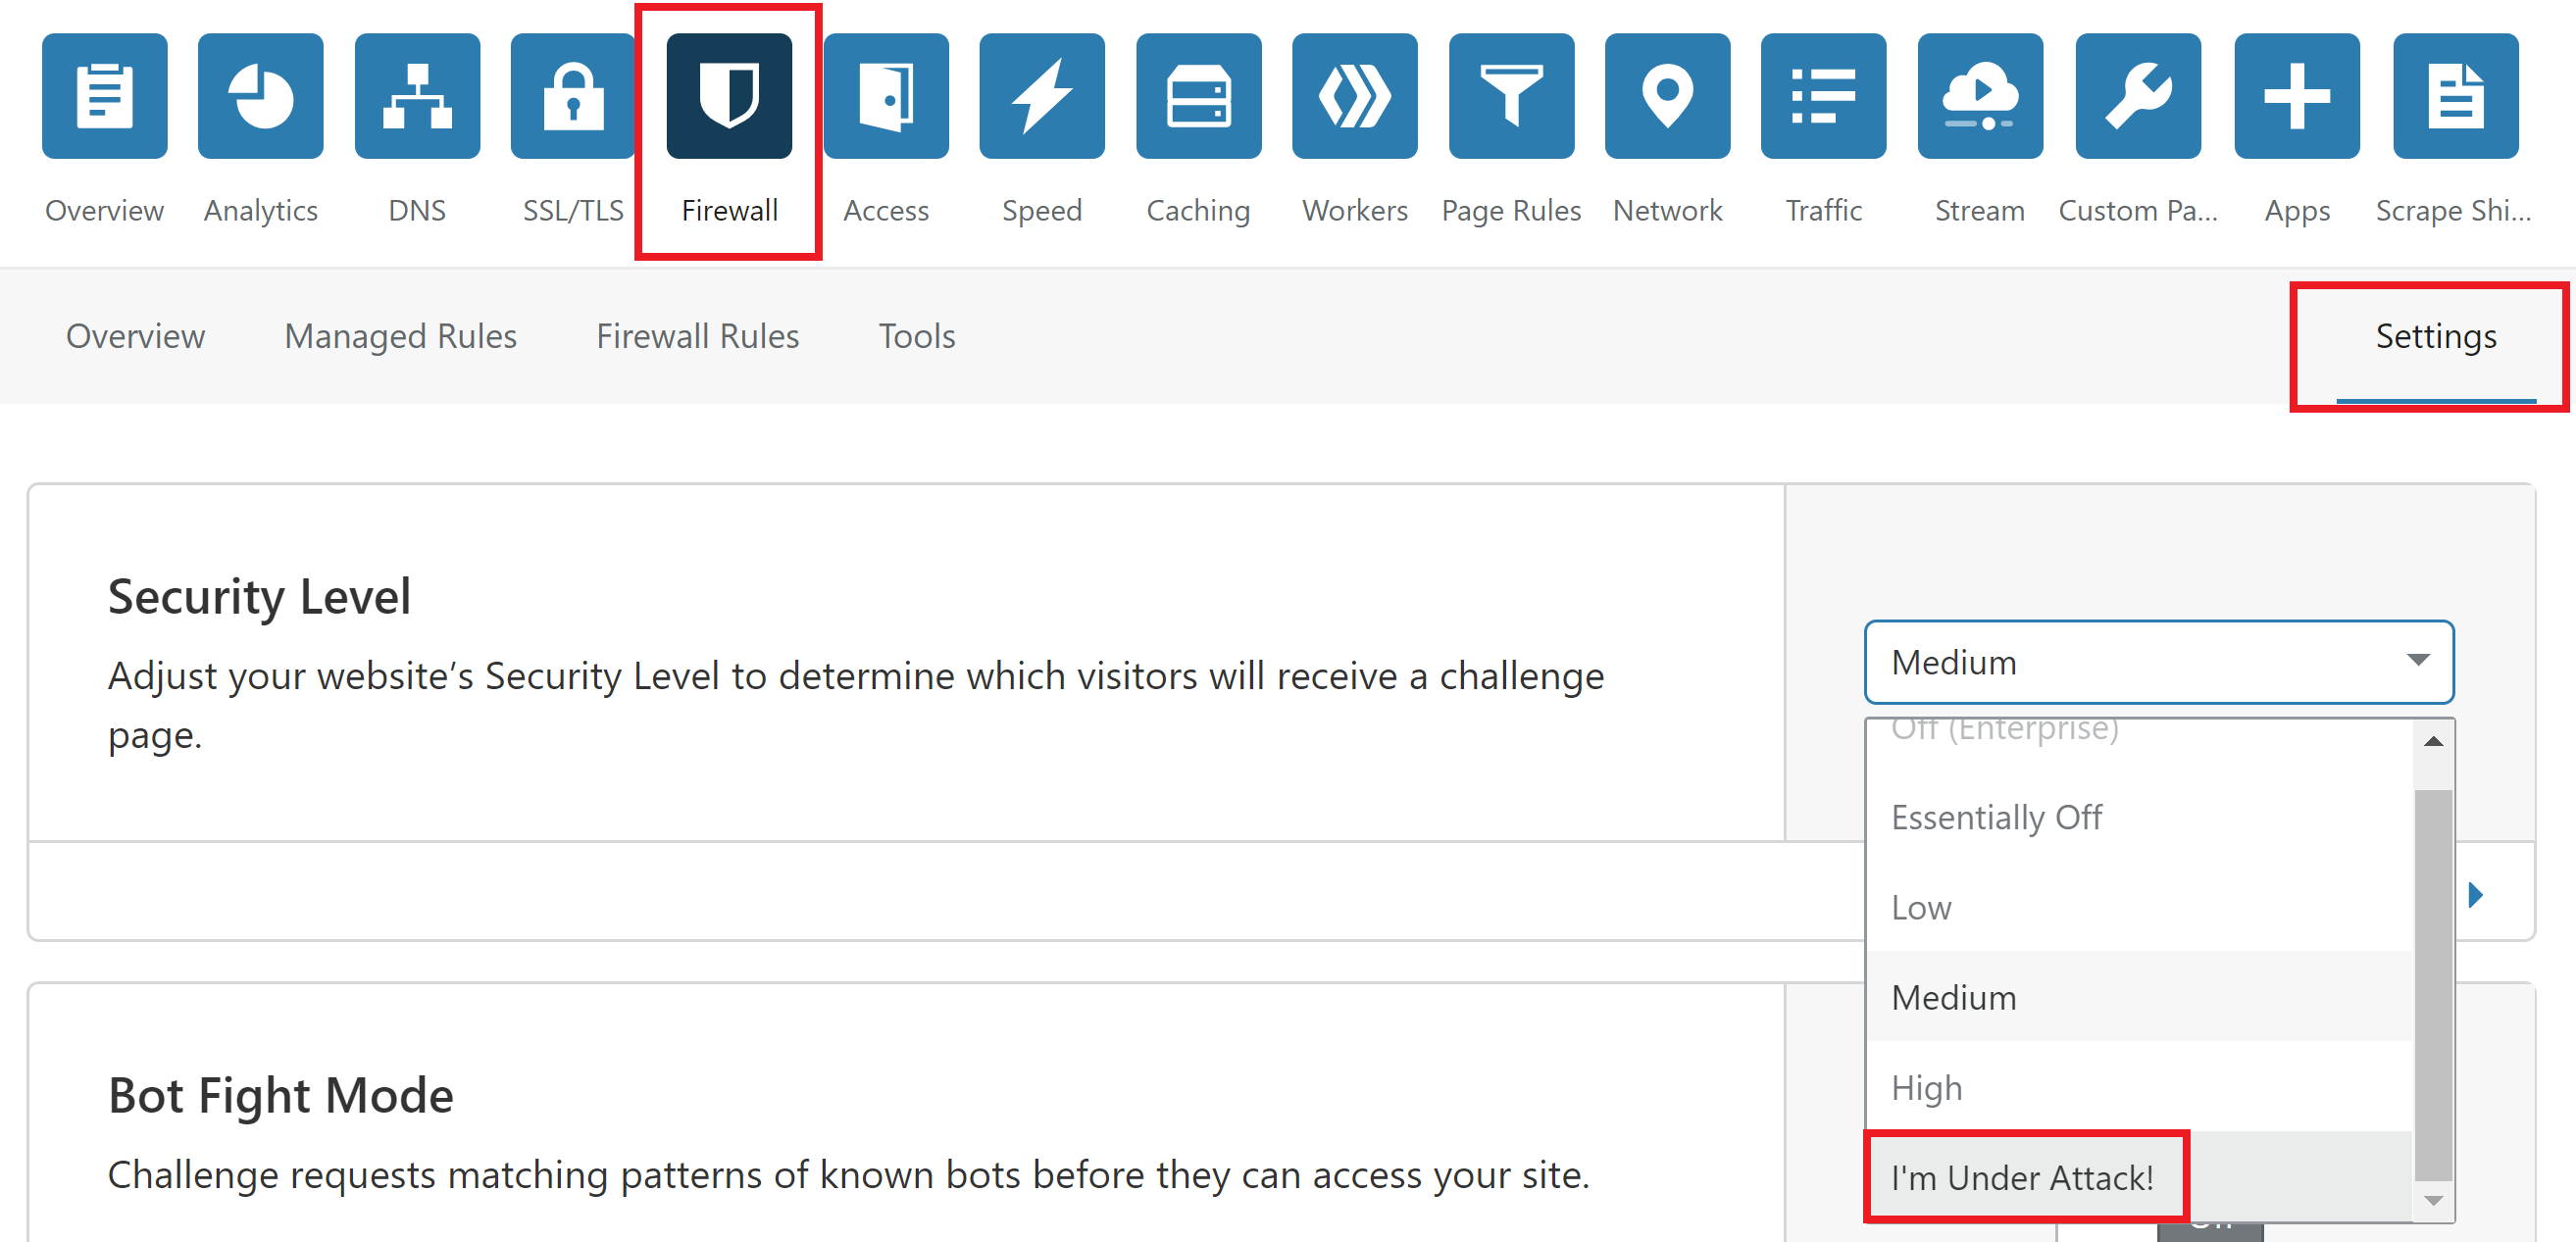
And if you’re not already on Cloudflare, consider a move there and activate DDOS protection. You can enable I’m Under Attack mode via the following steps:
- Log in to your Cloudflare account.
- Select the domain to protect.
- Click the Firewall app.
- Click the Settings tab.
- Under Security Level, select I’m Under Attack!
8. Has Your Site Been Compromised?
If your website has been hacked, this may be wreaking all kinds of havoc on your site and server. If you’re on our developer plan, we can install and run Malware detection software for you, and/or there are great WordPress security plugins that can scan your website for free such as Wordfence and Sucuri.
If you have been hacked, please check this article:
Further Troubleshooting Steps if CPU Usage is NOT High
1. CLEAR YOUR CACHE, WAIT A MINUTE OR TWO AND RETRY
If all looks healthy in Monit, then it may just have been a very brief outage that has now self-corrected. It’s also possible this was caching related, and a full cache clear via the self-help tools may remedy the issue immediately.
There’s no such thing as perfection 24/7. Sometimes a brief glitch may occur on one of your servers – unlikely as it may be – and it will quickly return back to normal. This may simply be a one-time thing, so continue to recheck your website for the next few minutes. If you notice it occurring frequently, then something deeper is likely happening.
2. DETERMINE IF THIS IS ACTUALLY A WEBSITE/SERVER ISSUE OR A CDN/FIREWALL/PROXY ISSUE
If your server is all green or doesn’t look like it should be experiencing time out issues, then it may be that neither the server nor website is at fault at all, and it may either be your CDN, DNS level firewall, or proxy server that are slowing things down.
Try deactivating these one by one so you can connect to your server directly without interference.
3. CLONE TO STAGING, SHUT PLUGINS DOWN IN STAGING ENVIRONMENT, REACTIVATE ONE BY ONE
This is a natural follow-on to #2 above. If you’re struggling to identify the cause of your slow load times, clone your site over to a staging environment, switch to a default theme, and deactivate all of your plugins. You now have a baseline to work with and can start activating your plugins one by one, and then your theme until you identify the root cause.
Fixing WordPress Login / WP-Admin 504 Errors / Upload Timeouts
These issues indicate an inefficient codebase.
The following settings can be adjusted to help fix your issue for the short term – especially if you’re simply uploading a file – but these are a band-aid that can help you diagnose and fix your website, not a solution.
NGINX HELPER SETTINGS
On Nginx servers, make sure the cache setting in the Nginx Helper plugin inside your site is set correctly so that it matches the cache setting in the UI. If Redis is active in the UI but the plugin is set to FastCGI (or vice versa) you may experience strange behaviour that could include 504 timeouts.
ADJUSTING PHP
To begin, you can first try adjusting your PHP settings. Here you can begin by changing the settings from the defaults to the follow:
- Max Execution Time: 600
- Max Input Time: 600
- Max Input Vars: 10000
ADJUST NGINX
Next, adjust the following Nginx settings. For this, you will need to SSH into your server – please see the guides listed in Part 4 above.
Run each of the following commands below.
Client Body Timeout
Default: 30
gp stack nginx -limits -client-body-timeout 600
Client Header Timeout
Default Setting: 30
gp stack nginx -limits -client-header-timeout 600
FastCGI Send Timeout
Default Setting: 60
gp stack nginx -fastcgi -send-timeout 600
FastCGI Read Timeout
Default Setting: 60
gp stack nginx -fastcgi -read-timeout 600
Proxy Send Timeout
Default Setting: 60
gp stack nginx -proxy -send-timeout 600
Proxy Read Timeout
Default Setting: 60
gp stack nginx -proxy -read-timeout 600
NEXT STEPS
If the above still doesn’t work you could also try adjusting your connection timeout settings and keep connection alive settings.
After that you will need to identify the root cause, which may mean switching on WordPress debug and query monitor, and then deactivating plugins one by one and switching to the default WordPress theme.
Once you know where the source of the issue is you can set about fixing it, or replacing it with a different solution.


