


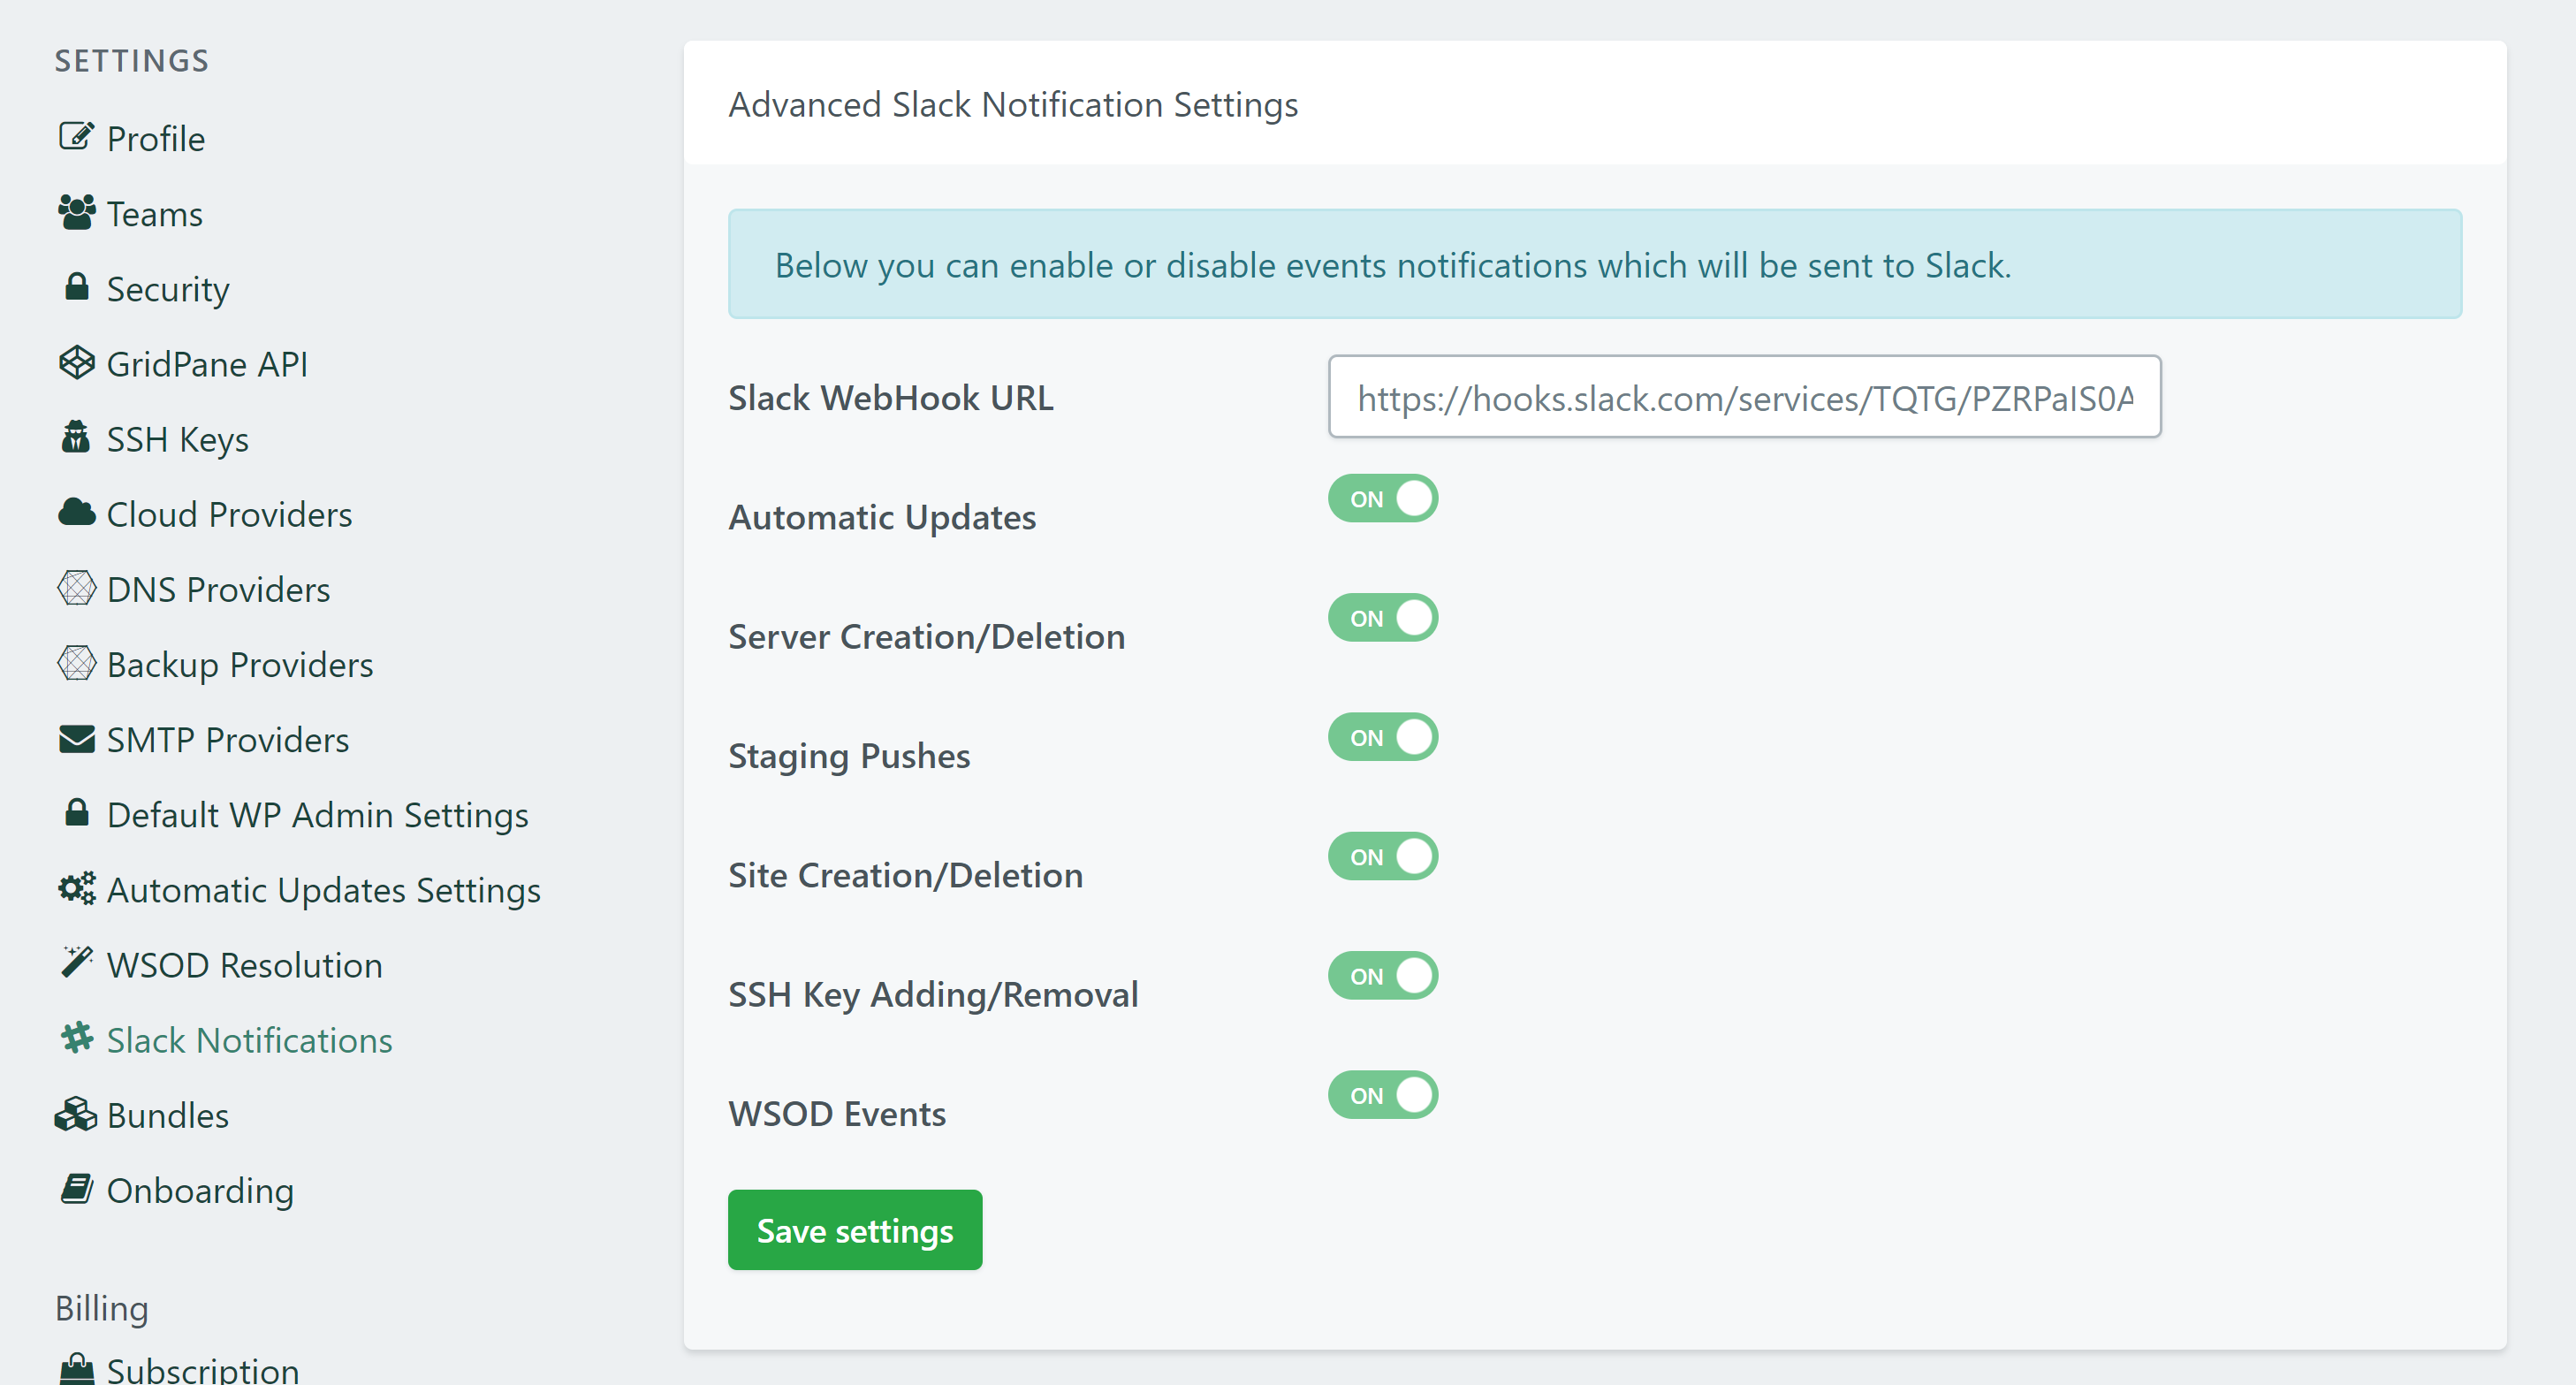
vCanopy has a very handy integration for Slack that will send you notifications about Monit activities, errors and warnings. We highly recommend that you take advantage of them, and you can learn how to do just that in this guide:
How to set up Slack Notifications
This article will focus on the actual notifications you may receive and what to do should you receive them. Many of the fixes will require that you SSH into your server to run your checks/commands. Below are articles to get you started if this is your first time:
Step 1. Generate your SSH Key
Step 2. Add your SSH Key to vCanopy (also see Add default SSH Keys)
Step 3. Connect to your server by SSH as Root user (we like and use Termius)
Account Activity Notifications
Inside your account you can choose to toggle ON/OFF specific notifications that relate to activities within your vCanopy account. For example, if a new SSH key is added to your account, you can have Slack notify when those events take place. These activity notifications include: –
- Automatic Updates (Update Safely)
- Server Creation/Deletion
- Staging Pushes
- Site Creation/Deletion
- SSH Key Adding/Removal
- WSOD Events
The rest of the notifications that follow below are Monit driven notifications.
Fail2Ban
If you receive a warning that Fail2Ban has failed, you can get it back up and running with the following command:
systemctl restart fail2ban
You can also check the log to see why this error occurred with the following:
cat /var/log/fail2ban.log
FAIL2BAN Error|Warning Logged!
Details
The FAIL2BAN service has failed on {host} {serverIP}, and Monit is unable to restart it successfully, please contact support.
FAIL2BAN LOG Error|Warning Logged!
Details
The FAIL2BAN service has failed on {host} {serverIP}, and has logged an Error or Warning….
Filesystem
For your server to run properly it requires a certain amount of free disk space. It you begin receiving filesystem space warning errors you will need to look at either cleaning up some space or resizing your server.
Monitoring FILESYSTEM Space!
Details
{service} Capacity Warning > 90%
The Filesystem on {host} {serverIP} has surpassed 90% disk capacity. Please consider upgrading your disk space.
Monitoring FILESYSTEM Space!
Details
{service} Capacity Warning > 95%
The Filesystem on {host} {serverIP} has surpassed 95% disk capacity. Really, it would be a great idea to scale your disk up now…”
Monitoring FILESYSTEM Space!
Details
{service} Capacity Warning > 98%
The Filesystem on {host} {serverIP} has surpassed 98% disk capacity. This is bad, things are about to go south… please scale up before it is too late…
Monitoring FILESYSTEM Space!
Details
{service} Capacity Warning > 99%”
The Filesystem on {host} {serverIP} has surpassed 99% disk capacity. Okay, this is where things are going to cascade fail… so long and thanks for all the fish!!!
MySQL
MySQL warnings could be due to a number of things. It may be that your site is experiencing heavy traffic (in which case Redis Object Caching may help considerably). or you may be experiencing database table locking.
The following articles will help uncover the information to spot your issue. First, try and identify the site causing the issues: –
- How to use the top command to monitor system processes
- How to use the htop command to monitor system processes
Next, diagnose what’s happening on the site: –
CPU HOT
MYSQL CPU_HOT Warning
MySQL on {host} {serverIP} has been using 70% of CPU for over 20 minutes… Things are running hot!
CPU RESTART
MYSQL CPU_RESTART Error
MySQL on {host} {serverIP} was using 90% of CPU for over 30 minutes… Things were too hot, we have restarted MySQL!
MEMORY USAGE HIGH
High memory usage may simply be a surge in traffic. If it persists, it will be restarted and you’ll receive another message to let you know a restart has taken place.
MYSQL MEM_HIGH Warning
MySQL has been using a lot of RAM for at least the last 10 minutes… it is exceeding the Monit allowed threshold!
MEMORY RESTART
If you’re experiencing regular MySQL restarts then you have a few options. You can: –
- Enable Redis object caching to reduce MySQLs workload
- Adjust the Monit MySQL Memory limit
- Scale up your server.
We recommend trying options and 1 and 2 first to determine if a resize is really necessary,
MYSQL MEM_RESTART Error
MySQL exceeded the Monit RAM threshold for the service for over 30 minutes. We have restarted MySQL to protect system integrity.
MYSQL FAILED
If MySQL has failed on your server you should be able to quickly restart it with either:
gp mysql -restart
gp mysql -start
If this fails please contact support over live chat – this is a critical issue.
MYSQL FAILED Error
MySQL has failed and Monit is unable to restart it successfully… please contact support.
Nginx
CPU HOT
If you receive a notice about Nginx causing CPU to run hot, please contact support so we can take a look. This is very rare.
NGINX CPU_HOT Warning
Nginx on {host} {serverIP} has been using 50% of CPU for over 20 minutes… Things are running a bit hot!
CPU RESTART
If Monit restarted Nginx due to high CPU usage, please contact support so we can take a look. This is very rare.
NGINX CPU_RESTART Error
Nginx on {host} {serverIP} was using 60% of CPU for over 10 minutes… Things were too hot, we have restarted Nginx!
MEMORY USAGE HIGH
NGINX MEM_HIGH Warning
Nginx has been using a lot of RAM for at least the last 10 minutes…
NGINX FAILED
If Nginx has failed on your server you should be able to quickly restart it with either:
gp nginx -restart
gp nginx -start
If this fails please contact support over live chat – this is a critical issue.
NGINX FAILED Error
Nginx has failed and Monit is unable to restart it successfully… please contact support.
NGINX SYNTAX ERROR
Syntax errors are serious. To solve them, we first need to identify the problem. Run the following command:
nginx -t
This will detail the syntax error that needs to be resolved. If you don’t know how to resolve it, please contact support over live chat and give us as much information as possible. We should be able to fix the issue rapidly and get Nginx back up and running.
NGINX CONF_SYNTAX Error
Your Nginx Configuration File has a syntax error… please check your server and/or contact support.
PHP
CPU HOT
If PHP is causing CPU issues, it’s likely that some code in one of your WordPress sites is causing some problems, which in turn is causing load times to run long.
The following articles will help uncover the information to spot your issue. First, try and identify the site causing the problem: –
- How to use the top command to monitor system processes
- How to use the htop command to monitor system processes
Next, diagnose what’s happening on the site: –
PHP CPU_HOT Warning
PHP on {host} {serverIP} has been using 70% of CPU for over 20 minutes… Things are running a bit hot!
PHP FAILED
If PHP fails, you can start or restart it with the following commands:
gp php $version -start
gp php $version -restart
The version refers to PHP version, for example if PHP 7.3 went down, then you restart it with:
gp php 7.3 -restart
If this fails please contact support over live chat – this is a critical issue.
PHP FAILED Error
PHP on {host} {serverIP} has failed and Monit is unable to restart it successfully… please contact support.
Redis
CPU HOT
If you receive a notice about Redis causing CPU to run hot, please contact support so we can take a look. This is very rare.
REDIS CPU_HOT Warning
Redis on {host} {serverIP} has been using 60% of CPU for over 20 minutes… Things are running hot!
CPU RESTART
If Monit restarted Redis due to high CPU usage, please contact support so we can take a look. This is very rare.
REDIS CPU_RESTART Error
Redis on {host} {serverIP} was using 90% of CPU for over 10 minutes… Things were too hot, we have restarted Redis!
MEMORY USAGE HIGH
REDIS MEM_HIGH Warning
Redis has been using a lot of RAM for at least the last 10 minutes… it is exceeding the Monit allowed threshold!
REDIS FAILED
If Redis has failed on your server you should be able to quickly restart it with either:
gp redis -restart
gp redis -start
If this fails please contact support over live chat – this is a critical issue.
REDIS FAILED Error
Redis has failed and Monit is unable to restart it successfully… please contact support.
System
If you receive any of the following System warnings, these articles will help you uncover the reasons behind them. That said, if this is causing serious performance problems them please reach out to support and let them know as much information as possible, including the specific slack notice and server IP.
First, try and identify the cause using either TOP or HTOP or both: –
- How to use the top command to monitor system processes
- How to use the htop command to monitor system processes
Next, if it’s not an attack or anythingdiagnose what’s happening on the site: –
SYSTEM LOAD AVERAGE
Note that “per core” refers to the system’s load average. 100% is equal to one vCPU, 200% is equal to two vCPU and so on.
SYS_LOAD_AVG_15 70% CPU Warning
{host} {serverIP} 15 Minute Load average has been running at over 70% per core for over 1 hour.
SYS_LOAD_AVG_15 100% CPU Warning
{host} {serverIP} 15 Minute Load average has been running at over 100% per core for over 30 minutes.
SYS_LOAD_AVG_15 200% CPU Warning
{host} {serverIP} 15 Minute Load average has been running at over 200% per core for over 10 minutes.
SYSTEM MEMORY USAGE
SYS_MEM_USAGE 90% RAM Warning
{host} {serverIP} System Memory utilisation has exceeded 70% RAM for over 1 hour.
SYS_MEM_USAGE 90% RAM Warning
{host} {serverIP} System Memory utilisation has exceeded 80% RAM for over 30 minutes.
SYS_MEM_USAGE 90% RAM Warning
{host} {serverIP} System Memory utilisation has exceeded 90% RAM for over 10 minutes.
SYSTEM CPU USAGE
SYS_CPU_USAGE {user} 30-70% CPU Warning
{host} ${serverIP} {user} CPU utilisation has exceeded 30-70%. This is nothing to be too concerned about yet…
SYS_CPU_USAGE {user} 70+% CPU Warning
{host} ${serverIP} {user} CPU utilisation has exceeded 70+%.
SYSTEM SWAP MEMORY
SYS_SWAP_MEM {aspect}% Usage Warning
{host} {serverIP} System Swap Memory usage has exceeded {aspect}% of allocation!
SSL Renewal
Cerbot renewal failures are normally from the previous server of a site, after a website has been moved. It’s always best to be sure though. Here’s how to check/troubleshoot.
Certbot Renewal Failure!
Domain: {site.url}
Server Name: {host}
Server IP: {serverIP}
Please contact support for help, or check /opt/vCanopy/certbot.monitoring.log for more details