


Part 1. Introduction
htop is the prettier, more colorful, and slightly more up-to-date version of top. A few metrics such as steal and iowait are easier to see in top, but for most other purposes, htop may be the better tool for troubleshooting server performance issues.
Here is our article on top, we’d recommend you start there and then come back to htop if you haven’t already read this:
How to use the top command to monitor system processes and resource usage
Just like top, this is an excellent skill to develop and will help you assist you in diagnosing any performance issues on your websites and server. It’s easy to use once you know the basics.
The goal of this article is to get you to a place where you can run the htop command on your server and understand the information that it’s displaying. Armed with this information you’ll be able to troubleshoot any performance issues you discover.
WHAT CAN htop SHOW YOU?
htop will display a real-time overview of what’s happening on your server. In a nutshell, you’ll be able to see the following at a glance: –
- The number of individual CPU’s on your server and their resource usage broken down individually
- RAM usage broken down by processes, buffer and disk cache
- Swap usage
- Total number of tasks, thread count, and the number of running tasks
- 1 minute, 5 minutes, and 15 minutes load averages
- System uptime and current time (by default this is set to UTC time)
- A break down of running processes
GETTING STARTED
A note on system users – we highly recommend putting each of your websites on their own system user. Not only is important to keep your websites isolated from each other (a hacked/malware infected website can’t affect sites on a different system user), it will also show in the USER column, so you can easily identify any site with high resource usage using either top or htop. For example, if my website was assigned to a system user called “steve”, in the USER column, you’ll see the user “steve” and know exactly which site you need to look into. If they were all on the default “vCanopy” user, you won’t be able to tell what’s going on.
To run the top command you will need to SSH into your server. Please see the following articles to get started:
Generate SSH Key on Windows with Putty
Generate SSH Key on Windows with Windows Subsystem for Linux
Generate SSH Key on Windows with Windows CMD/PowerShell
Add your SSH Key to vCanopy:
Add/Remove an SSH Key to/from an Active vCanopy Server
Connect to your server:
Connect to a vCanopy server by SSH as Root user.
Once inside your server run:
htop
To exit htop use Q or CTRL+C.
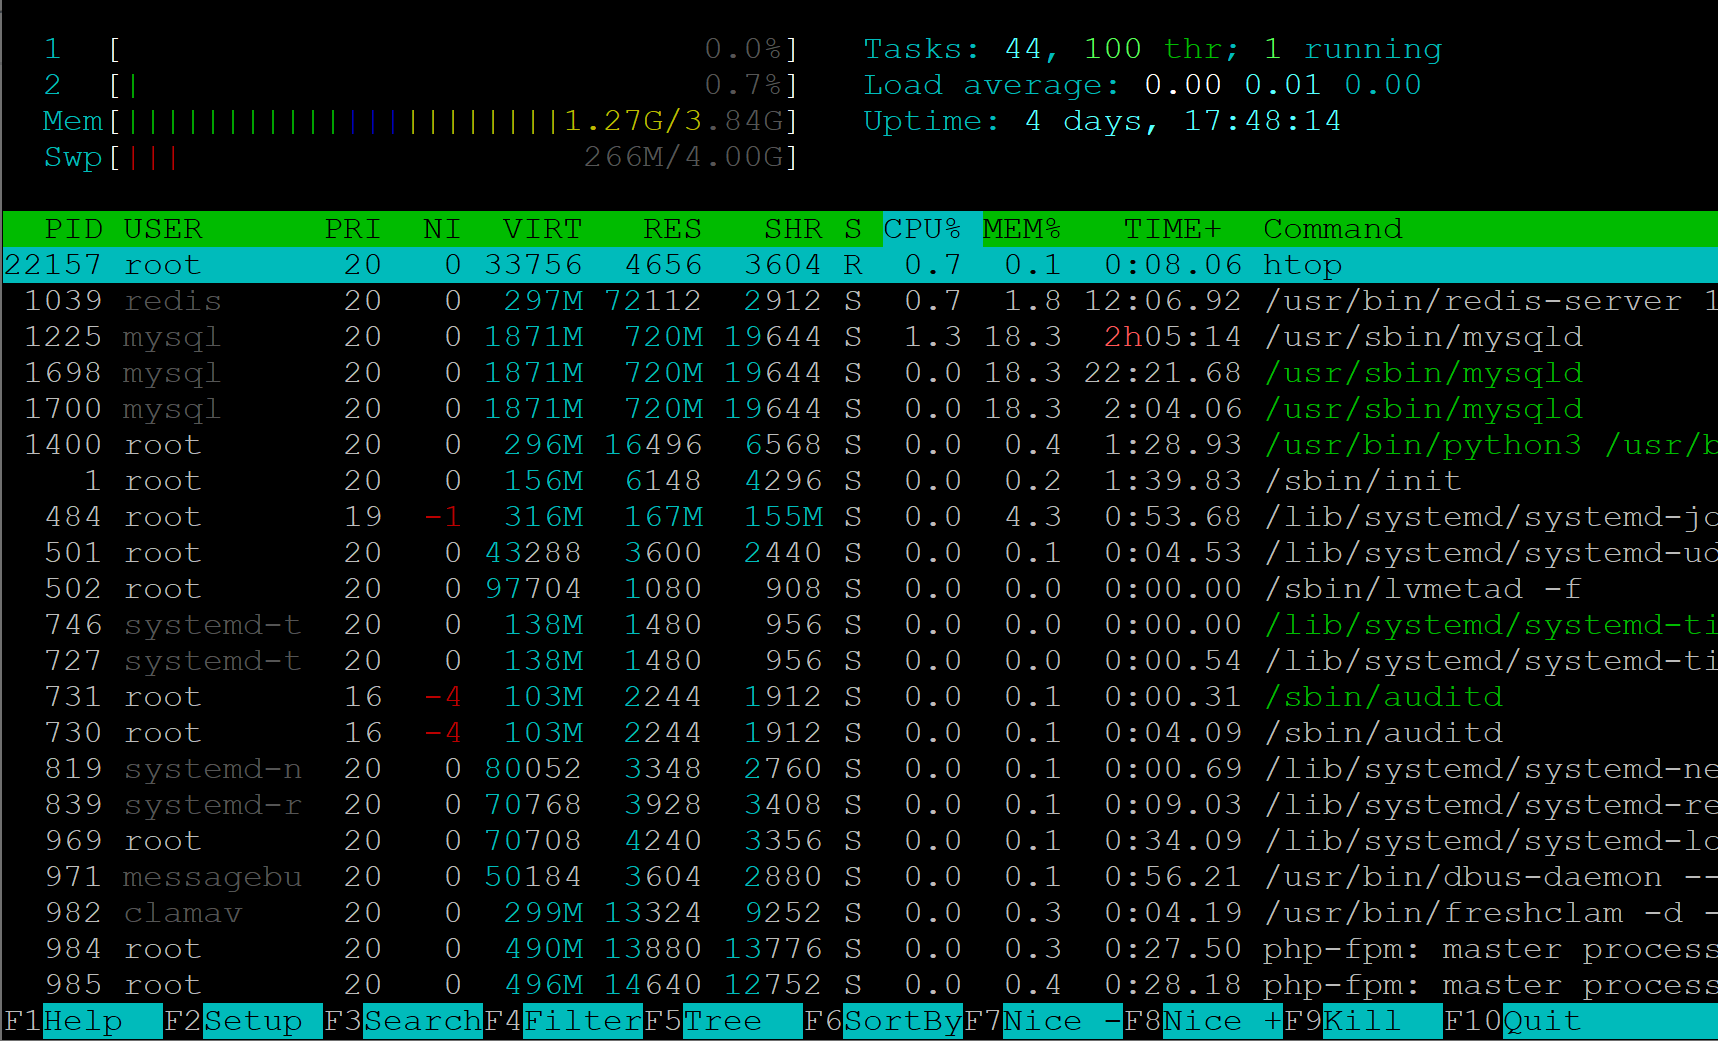
Part 2. The htop summary area – what it all means
The summary area at the beginning is the system overview. Below we’ll cover what each part means, section by section.
CPU BREAKDOWN
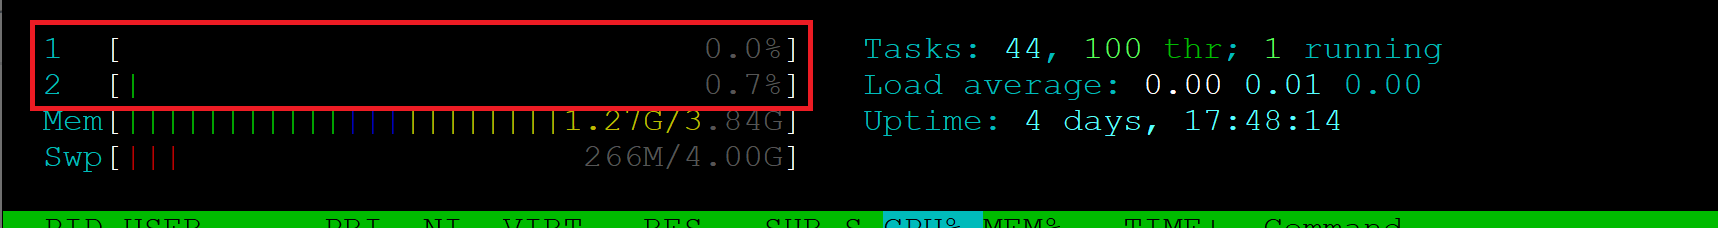
Here, with the numbers 1 and 2, we can see this is a 2 core VPS. A 4 core will have 4 bars, 8 core = 8 bars, and so on. Each number/bar represents one CPU. Each bar has a % on the right-hand side indicating how much CPU is in use.
Specific CPU usage is then broken down by processes via the following color code:
- Blue: The % of CPU used by low priority processes
- Green: The % of CPU used for user processes
- Red: The % of CPU used by system/kernel processes
Bonus points: –
- Yellow/Orange: The % of CPU used by IRQ time
- Magenta: The % of CPU used by Soft IRQ time
- Grey: The % of CPU by IO Wait time
- Cyan: The % of CPU by Steal
top maybe easier to understand in terms of what exactly is consuming CPU, but what we’re looking to see is just how busy are the CPU/s. In this article, the bars are mostly empty, which means the CPU is mostly idle.
The higher your CPU usage (full bars, higher percentage), the busier your system is, and this will affect the performance of your websites.
Bursts of high usage are normal and nothing to be concerned about. Sustained high CPU usage is something that requires further attention.
RAM AND SWAP USAGE
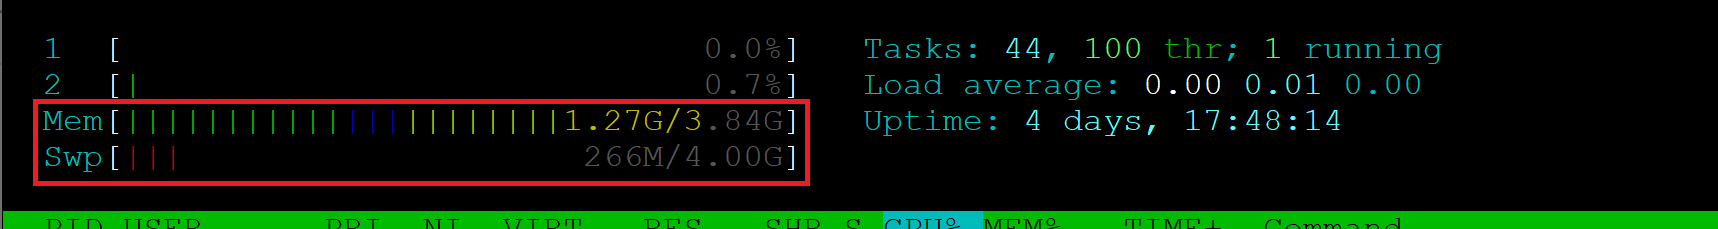
This section shows information regarding the memory usage of the system. We have RAM and Swap – Swap is part of your hard disk that’s used by your server like it uses RAM. This is why having spare disk space is important for your system, and why performance issues can arise when your disk space usage gets past 90%. If you use software such as Photoshop, Illustrator, or other heavy Adobe Creative Cloud apps you’ll likely have experienced the same thing on your computer.
RAM usage is broken down by colors.
- Green: Used memory pages
- Blue: Buffer pages
- Yellow: Cache pages
Swap space is your safety net for if you run out of RAM. High swap and RAM usage will affect your system’s ability to process tasks efficiently, potentially results in 504 time out errors. Processes will get slower and backed up while they wait for memory to become available.
TASKS
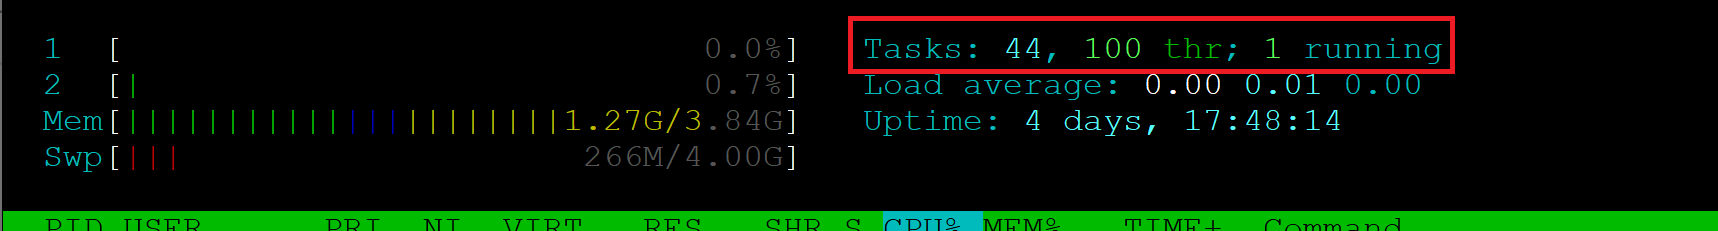
For clarity, Tasks and Processes for our purposes are the same thing. Here we have 44 total processes, with 1 currently running. 100 “thr” means “threads”. So here we have 44 tasks that are broken up into 100 threads.
LOAD AVERAGE
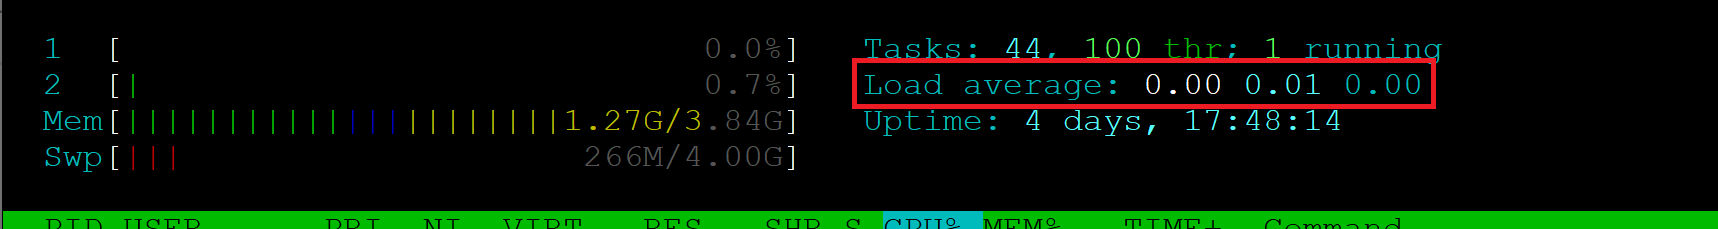
This is the exact same breakdown that the top command gives. If you haven’t already read that article, please check it out (link at the top and bottom of this article). In a nutshell, here we can see the average “load” over one, five, and fifteen minutes.
Load is measured per CPU, so if you have more than one core, you will need to divide what you see by the number of cores your server is running. Sustained, high load times means your server is consistently busy. This could be due to a number of reasons, such as high website traffic or a brute force attack. The rest of the data provided by htop should help fill in the gaps.
SYSTEM UPTIME AND CURRENT SYSTEM TIME
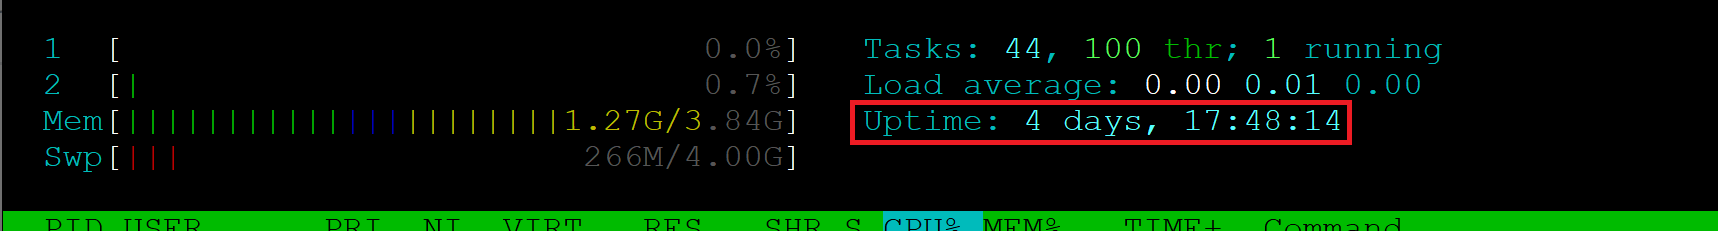
Here you can see how long the server has been online for, and the current system time,. For our purposes, this isn’t particularly important.
Part 3. Active processes
So you now have an overview of what’s happening on your server at a glance. If you’re seeing high resource usage, we now need to look at the processes themselves to see what’s responsible.
The active process list is the lower part of the overview. This is highlighted below:
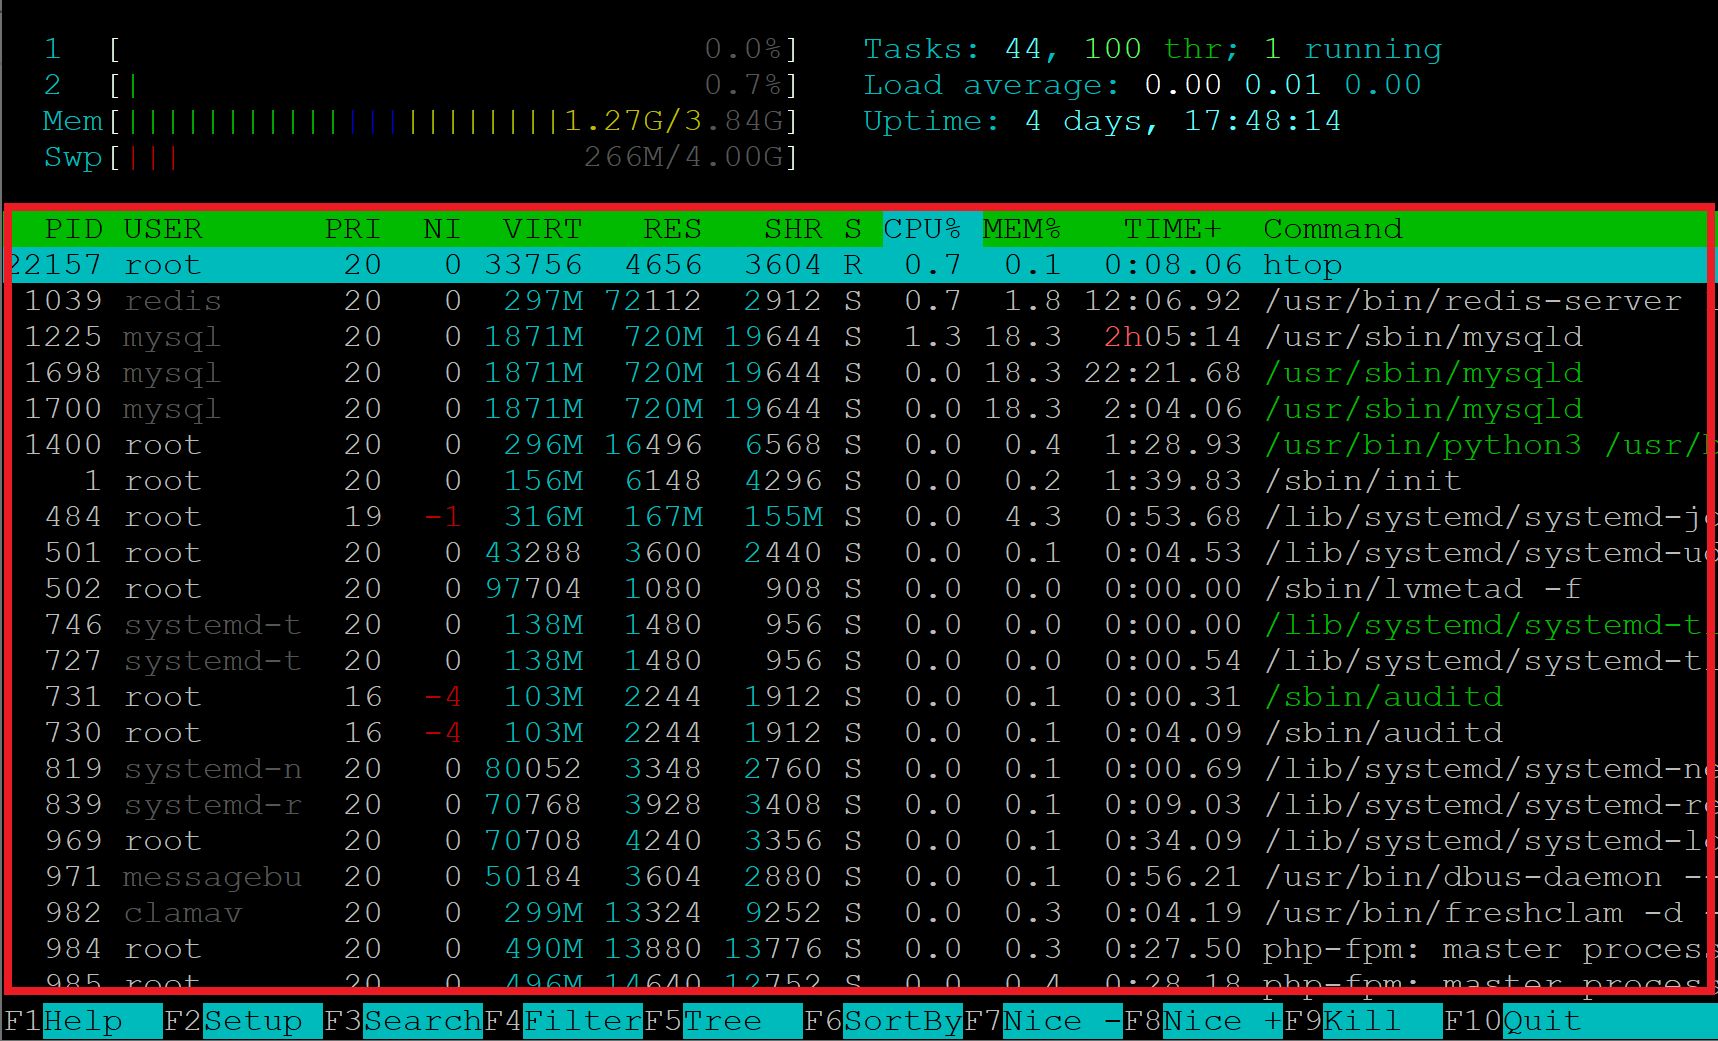
Below is a quick break down of what each column displays: –
- PID: Displays a task’s unique process ID
- USER: The username of the user who started the task
- PRI: Shows the scheduling priority of the task.
- NI: Represents the nice value of the task. We covered this above in the CPU section in part 2. Nice affects the priority of a task – 19 being the lowest priority, -20 being highest
- VIRT: Shows the total amount of memory used by the task
- RES: Shows the memory consumed by the process in RAM (in kb)
- SHR: Represents the amount of shared memory (in kb) used by the task
- S: The current status of the process (zombie, sleeping, running, uninterruptedly sleeping, or traced).
- CPU%: Represents the percentage of CPU used by each process
- MEM%: Shows the percentage of total available RAM used by each process
- TIME+: The total amount of CPU Time used by the task, shown in hundredths of a second.
- COMMAND: The name of the running process
Below these in the footer are htop‘s menu items. More on these below.