Verdant TCS

Using the PHP Slow Log

5 min read

Introduction

PHP slow logging can be an extremely useful debugging tool for tracking down long-running requests that can lead to performance bottlenecks for your WordPress websites. By identifying the specific requests that are running slow, you can set about either fixing the code itself or replacing the plugin responsible for the bottleneck (it’s almost always a plugin). The PHP Slow Log is currently only available on Nginx servers.

Table of Contents

  1. Background Information
  2. Activating/Deactivating PHP Slow Logging
  3. Manually Using the PHP Slow Log
  4. Reading the PHP Slow Log
  5. Additional Resources

Background Info

Slow PHP scripts may go unnoticed on a site for an extended period of time (or forever) if the site itself is fully cached and/or the amount of traffic the website receives isn’t enough to put a strain on a server.

On a busy dynamic website though (Woo, LMS, etc), slow PHP scripts can cause serious performance issues that result in 504 and 502 timeouts, and maxing out a server’s CPU and/or RAM.

WordPress is a single-threaded application, meaning that one WordPress request (page load, search request, product filtering, etc), no matter how complex, is handled by one PHP worker, which consumes 1 vCPU for the duration of the request. A slow PHP script can create a bottleneck which causes these requests to take a long time to complete and clog up a server’s available CPU and PHP worker pool.

When this happens during a period of high traffic, the server can potentially quickly max out its resources as it can’t complete the incoming requests faster than the rate at which they’re coming in, leading to slow pages, 502/504 timeouts, and a negative experience for your visitors (and potentially any other websites on the same server).

You can learn more about PHP workers in this comprehensive guide:

PHP Workers and WordPress: A Guide for Better Performance

Additional performance troubleshooting resources are linked at the bottom of the article.

Activating and Deactivating PHP Slow Logging

The PHP slow log, like the MySQL slow query log, is useful for diagnosing long running processes that are having a negative effect on your website’s performance. Below we’ll look at how to configure it so that you can begin diagnosing individual sites as needed.

Step 1. Navigate to the PHP Slowlog Tab

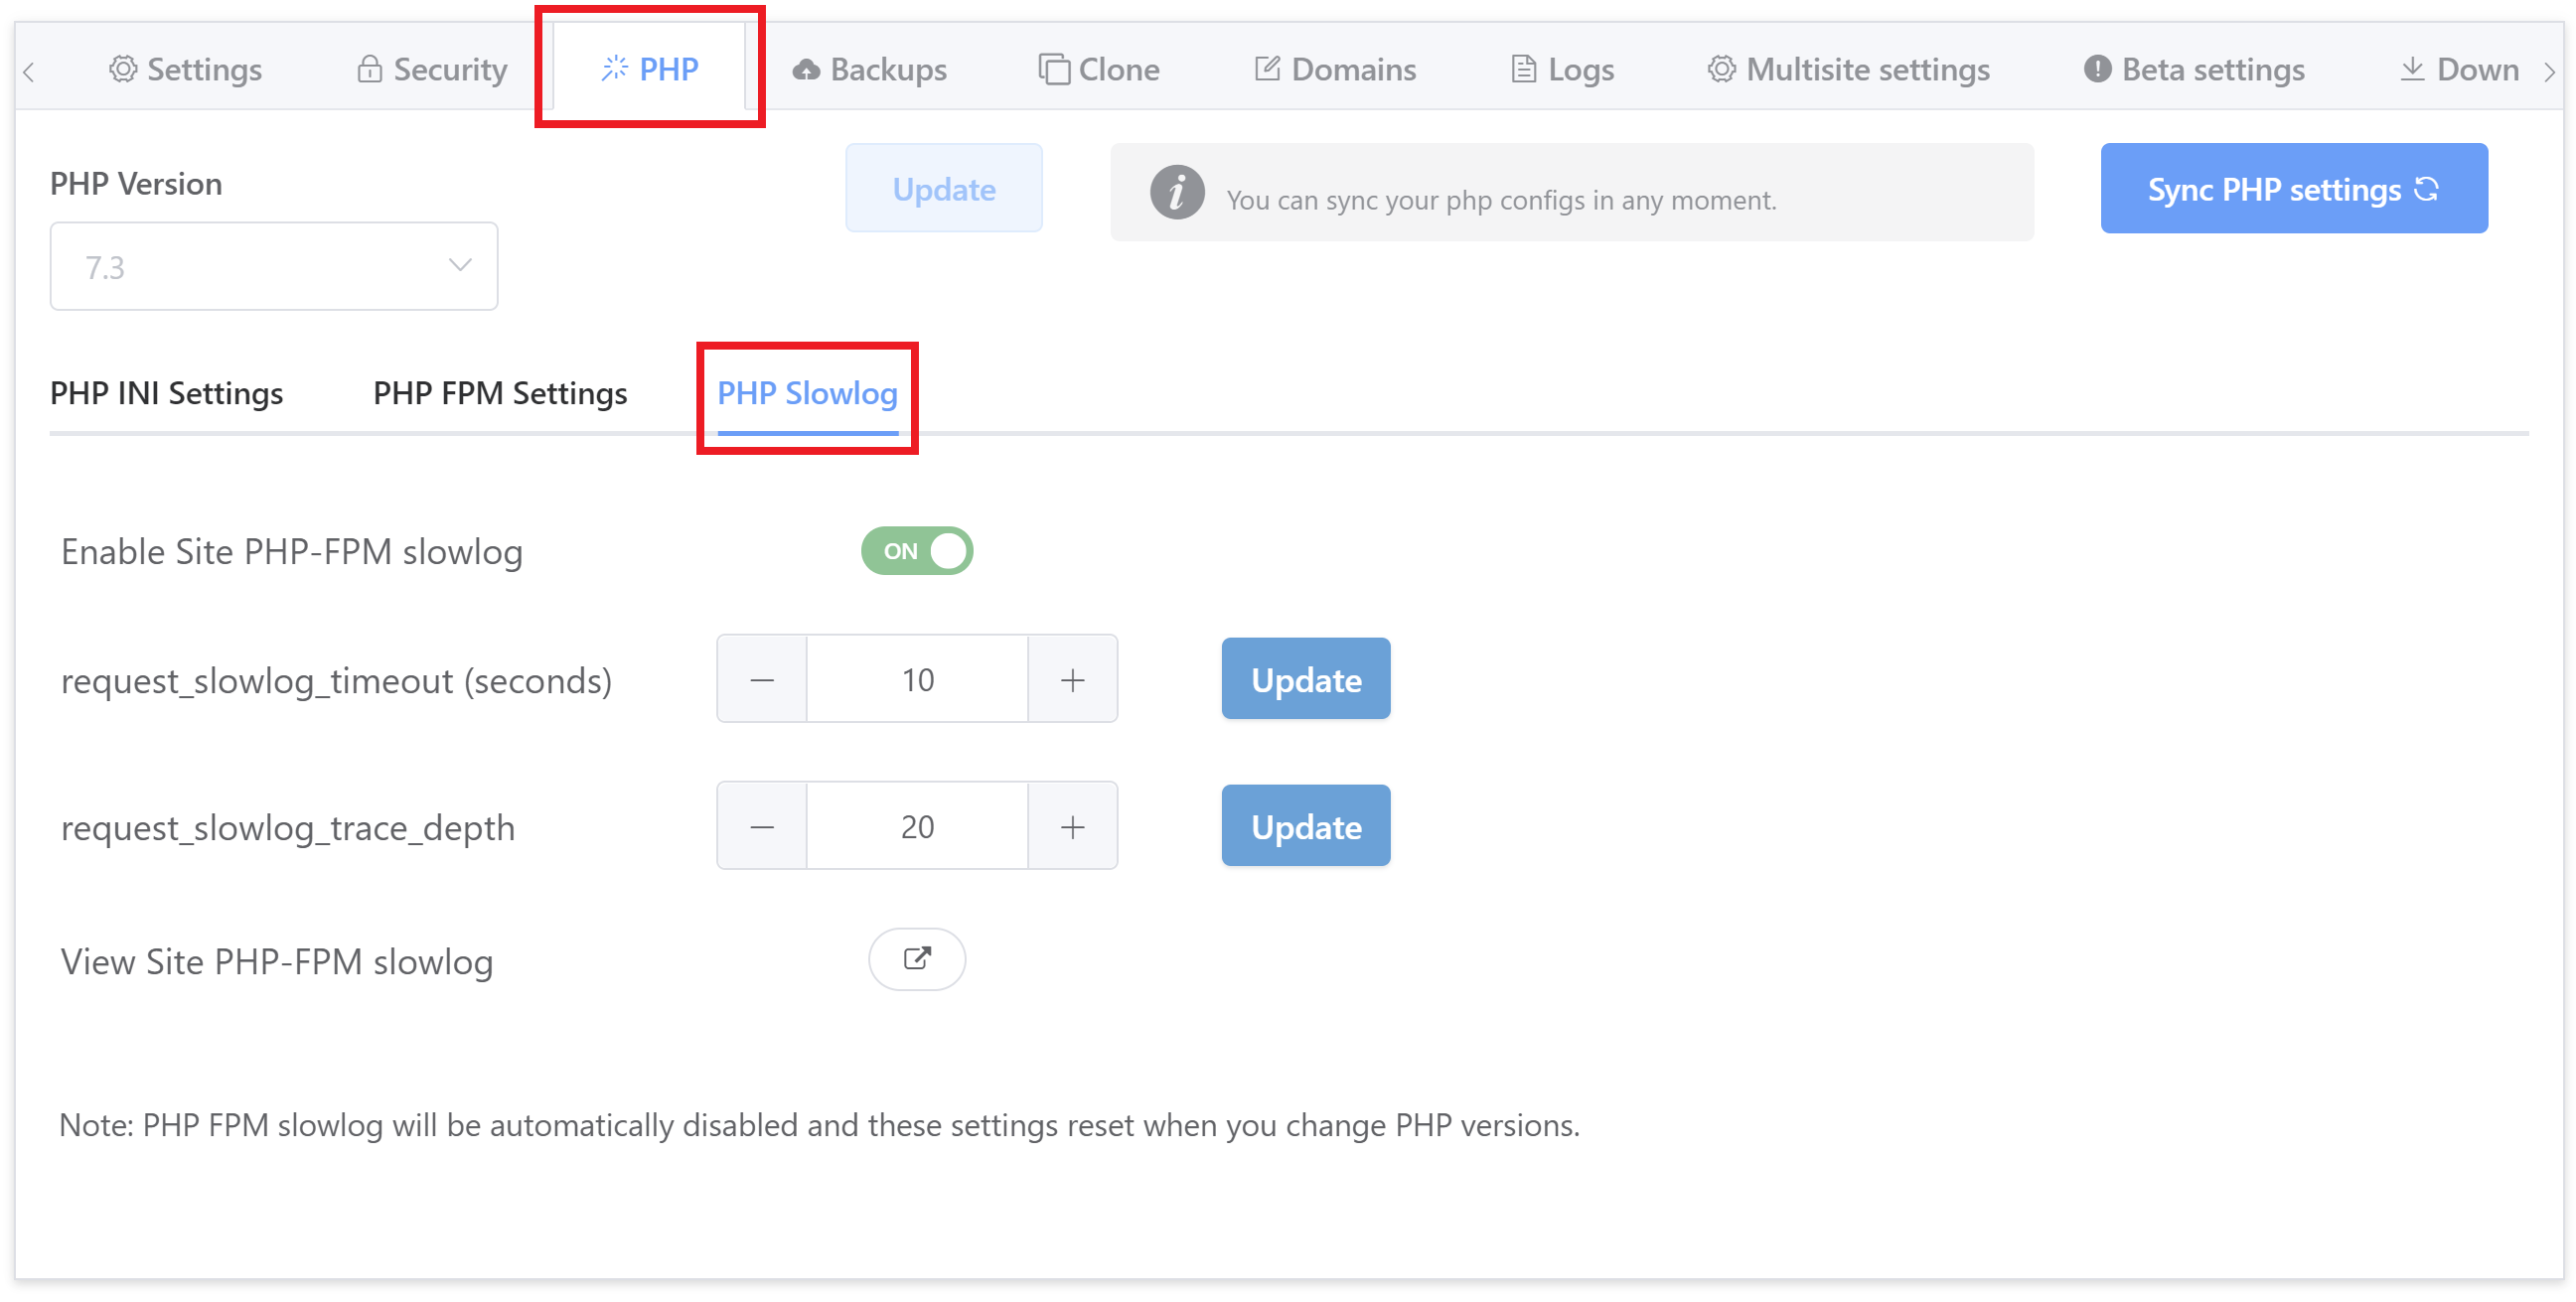
The PHP Slow log is also located in the website configuration modal, inside the PHP tab:

Step 2. Turn Slow-logging On/Off

Toggle “Enable Site PHP-FPM Slowlog” to ON/OFF.

Step 3. Configure Logging Parameters

  • The request_slowlog_timeout directive is used to set the minimum time a single request needs to run before a PHP backtrace for that request will be logged. On vCanopy this is configured in seconds.
  • The request_slowlog_trace_depth sets how many functions proceeding the slow running process should be logged.

Step 4. Check Back Soon

Allow some time for data to be collected and check the log for slow-running processes, and then click the button next to “View Site PHP-FPM slowlog” to display the contents of the log.

Slowlog Server Location

The log name will vary depending on which version of PHP you’re using, but it will be located in /var/log. The log will be your websites name, followed by the PHP version without the “.” between the two numbers.

Here’s an example for PHP 7.4:

/var/log/site.url74.log.slow

Important

Always deactivate the PHP slowlog once you've completed your debug.

Manually Using the PHP Slow Log

Here’s how to activate and use PHP slow logging via the command line.

Activation/Deactivation

For Panel users, you can activate PHP slow logging with the following commands (replace site.url with your website URL):

gp stack php -site-slowlog true site.url

And you can deactivate it with:

gp stack php -site-slowlog false site.url

Slow Log Timeout Settings

You can set the minimum time (request_slowlog_timeout) that you want queries to have to exceed to be logged with:

gp stack php -site-slowlog-timeout {accepted.value} site.url

The value is in seconds. For example, for 5 seconds with:

gp stack php -site-slowlog-timeout 5 site.url

Slow Log Timeout Settings

You can set the minimum time that you want queries to have to exceed to be logged with:

You can set how many functions proceeding the slow running process should be logged (request_slowlog_trace_depth) with:

gp stack php -site-slowlog-trace-depth {accepted.value} site.url

For example, to set it 15 functions you can use the following:

gp stack php -site-slowlog-trace-depth 15 site.url

View the Log

The log name will vary depending on which version of PHP you’re using, but it will be located in /var/log. The log will be your website’s name, followed by the PHP version without the “.” between the two numbers.

Here’s an example for PHP 7.4:

cat /var/log/site.url74.log.slow

Important

Always deactivate the PHP slowlog once you've completed your debug.

Reading the PHP Slow Log

The slowlog output will look similar to the following:

[09-Mar-2022 22:25:08] [pool example.com74] pid 20039
script_filename = /var/www/example.com/htdocs/wp-cron.php
[0x00007fe04e814520] [INCLUDE_OR_EVAL]() /var/www/example.com/htdocs/wp-content/plugins/wordfence/wordfence.php:115
[0x00007fe04e814440] [INCLUDE_OR_EVAL]() /var/www/example.com/htdocs/wp-settings.php:418
[0x00007fe04e814290] [INCLUDE_OR_EVAL]() /var/www/example.com/wp-config.php:133
[0x00007fe04e814210] [INCLUDE_OR_EVAL]() /var/www/example.com/htdocs/wp-load.php:55
[0x00007fe04e814170] [INCLUDE_OR_EVAL]() /var/www/example.com/htdocs/wp-cron.php:44

Each request is logged in a block separated by a line space. The line highlighted red is the PHP script requested. As the slowlog only captures the script and not the URI responsible, you may need to match this up to the URI via the website’s access.log.

Directly below this begins the stacktrace, and here the first line of the stracktrace (highlighted black) is the executing function at the time when the request_slowlog_timeout time is exceeded.

Some requests, such as the wp-cron in the example, can probably be safely ignored (though it can happen that an old site may retain a lot of unnecessary cronjobs). Others will identify clear problems that need to be fixed.

If this example was a real slowlog for a site, then disabling the Wordfence plugin may have alleviated the issue as this first line in the stack trace is typically the offending script causing the bottleneck.

The remaining lines below detail the functions called before this script.

3 Common Causes

  1. wp-cron.php as already mentioned can sometimes result in slow, behind the scenes requests. They usually don’t represent an issue that needs to be addressed, but there are rare occurrences where wp-cron can overload a server and where old sites have accumulated a high number of unnecessary cron jobs (if you think this may be your issue check out the WP Crontrol plugin).
  2. mysqli_query is where PHP -> MySQL interactions are inefficient and/or missing indexes. MySQL slow logging can help track down long running queries so they can be fixed.
  3. curl_exec is where your site is reaching out to an external service/website and it’s taking a long time for this request to complete. Make sure the requests being made are necessary and that the external site/service isn’t rate limiting your requests.

Additional Resources

The PHP slow log is just one of the resources available to you for troubleshooting performance-related issues. The following features and guides may also be beneficial:

  1. Using the MySQL Slow Log
  2. WordPress Debug and Query Monitor
  3. Diagnosing Performance Issues and 504 Timeouts
  4. Diagnosing 502 Errors


You could also install an Application Monitoring tool:

  1. Installing and Configuring New Relic for WordPress
  2. How to set up Netdata on your vCanopy Servers

Search the Knowledge Base

New to vCanopy?

Get started with our FREE Core plan today! We bring the software, you bring the hardware.